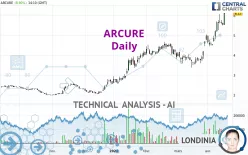
ARCURE - Daily - Technical analysis published on 04/17/2024 (GMT)
- 153
- 0
Click here for a new analysis!
- Timeframe : Daily
- - Analysis generated on
- Status : TARGET REACHED

Summary of the analysis

Additional analysis
Quotes
The ARCURE price is 6.12 EUR. The price registered an increase of +8.90% on the session and was traded between 5.52 EUR and 6.12 EUR over the period. The price is currently at +10.87% from its lowest and 0% from its highest.Here is a more detailed summary of the historical variations registered by ARCURE:
New HIGH record (1 year)
Type : Bullish
Timeframe : Weekly
New HIGH record (1st january)
Type : Bullish
Timeframe : Weekly
New HIGH record (1 month)
Type : Bullish
Timeframe : Weekly
The Central Volumes scanner detects abnormal volumes on the asset:
Abnormal volumes
Timeframe : 5 days
Abnormal volumes
Timeframe : 20 days
Technical
A technical analysis in Daily of this ARCURE chart shows a strongly bullish trend. 92.86% of the signals given by moving averages are bullish. The overall trend is supported by the strong bullish signals from short-term moving averages. The Central Indicators market scanner currently does not detect any result that concerns moving averages.
In fact, 16 technical indicators on 18 studied are currently bullish. But beware of excesses. The Central Indicators scanner currently detects this:
RSI indicator is overbought : over 70
Type : Neutral
Timeframe : Daily
CCI indicator is overbought : over 100
Type : Neutral
Timeframe : Daily
Williams %R indicator is overbought : over -20
Type : Neutral
Timeframe : Daily
Pivot points : price is over resistance 3
Type : Neutral
Timeframe : Daily
The analysis of the price chart with Central Patterns scanners does not return any result.
The Central Candlesticks scanner which studies Japanese candlesticks did not detect anything.
| S3 | S2 | S1 | Price | |
|---|---|---|---|---|
| ProTrendLines | 4.00 | 4.56 | 4.99 | 6.12 |
| Change (%) | -34.64% | -25.49% | -18.46% | - |
| Change | -2.12 | -1.56 | -1.13 | - |
| Level | Major | Major | Intermediate | - |
To determine price objectives, it is also possible to use the pivot points. Here is the price position in relation to pivot points:
| Pivot points | S3 | S2 | S1 | PP | R1 | R2 | R3 |
|---|---|---|---|---|---|---|---|
| Standard | 5.39 | 5.45 | 5.53 | 5.59 | 5.67 | 5.73 | 5.81 |
| Camarilla | 5.58 | 5.59 | 5.61 | 5.62 | 5.63 | 5.65 | 5.66 |
| Woodie | 5.41 | 5.46 | 5.55 | 5.60 | 5.69 | 5.74 | 5.83 |
| Fibonacci | 5.45 | 5.50 | 5.53 | 5.59 | 5.64 | 5.67 | 5.73 |
| Pivot points | S3 | S2 | S1 | PP | R1 | R2 | R3 |
|---|---|---|---|---|---|---|---|
| Standard | 3.54 | 4.11 | 4.91 | 5.48 | 6.28 | 6.85 | 7.65 |
| Camarilla | 5.32 | 5.45 | 5.57 | 5.70 | 5.83 | 5.95 | 6.08 |
| Woodie | 3.65 | 4.17 | 5.02 | 5.54 | 6.39 | 6.91 | 7.76 |
| Fibonacci | 4.11 | 4.64 | 4.96 | 5.48 | 6.01 | 6.33 | 6.85 |
| Pivot points | S3 | S2 | S1 | PP | R1 | R2 | R3 |
|---|---|---|---|---|---|---|---|
| Standard | 2.22 | 2.80 | 3.89 | 4.47 | 5.56 | 6.14 | 7.23 |
| Camarilla | 4.53 | 4.68 | 4.84 | 4.99 | 5.14 | 5.30 | 5.45 |
| Woodie | 2.49 | 2.93 | 4.16 | 4.60 | 5.83 | 6.27 | 7.50 |
| Fibonacci | 2.80 | 3.44 | 3.83 | 4.47 | 5.11 | 5.50 | 6.14 |
Numerical data
The following are the details of the technical indicators and moving averages that were collected to generate this technical analysis:
| RSI (14): | 78.17 | |
| MACD (12,26,9): | 0.4800 | |
| Directional Movement: | 35.49 | |
| AROON (14): | 100.00 | |
| DEMA (21): | 5.56 | |
| Parabolic SAR (0,02-0,02-0,2): | 5.19 | |
| Elder Ray (13): | 0.55 | |
| Super Trend (3,10): | 4.77 | |
| Zig ZAG (10): | 6.10 | |
| VORTEX (21): | 1.2200 | |
| Stochastique (14,3,5): | 87.24 | |
| TEMA (21): | 5.86 | |
| Williams %R (14): | 0.00 | |
| Chande Momentum Oscillator (20): | 1.11 | |
| Repulse (5,40,3): | 15.2900 | |
| ROCnROLL: | 1 | |
| TRIX (15,9): | 1.1500 | |
| Courbe Coppock: | 74.84 |
| MA7: | 5.65 | |
| MA20: | 4.78 | |
| MA50: | 4.37 | |
| MA100: | 3.63 | |
| MAexp7: | 5.59 | |
| MAexp20: | 5.00 | |
| MAexp50: | 4.41 | |
| MAexp100: | 3.87 | |
| Price / MA7: | +8.32% | |
| Price / MA20: | +28.03% | |
| Price / MA50: | +40.05% | |
| Price / MA100: | +68.60% | |
| Price / MAexp7: | +9.48% | |
| Price / MAexp20: | +22.40% | |
| Price / MAexp50: | +38.78% | |
| Price / MAexp100: | +58.14% |
News
The last news published on ARCURE at the time of the generation of this analysis was as follows:
- Annual results 2023: a solid profitability, EBE and net income highly increased
- 2021 revenue up 33% to EUR 10.4 million - Profitable growth outlook
- Arcure launches its new solution: Blaxtair Connect
- Arcure Joins the CITF in Hong Kong and Boosts Its International Development
- Arcure Signs a New Industrial Partnership to Manufacture Blaxtair in France
About author

Online


Add a comment
Comments
0 comments on the analysis ARCURE - Daily