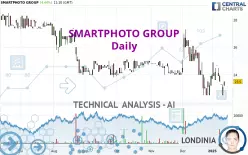
SMARTPHOTO GROUP - Daily - Technical analysis published on 01/14/2025 (GMT)
- 74
- 0
Click here for a new analysis!
- Timeframe : Daily
- - Analysis generated on
- Status : TARGET REACHED

Summary of the analysis

Additional analysis
Quotes
SMARTPHOTO GROUP rating 23.5 EUR. The price has increased by +4.44% since the last closing and was traded between 23.2 EUR and 23.5 EUR over the period. The price is currently at +1.29% from its lowest and 0% from its highest.The Central Gaps scanner detects a bullish opening. A small advantage for buyers in the very short term.
Bullish opening
Type : Bullish
Timeframe : Openning
Here is a more detailed summary of the historical variations registered by SMARTPHOTO GROUP:
Near a new LOW record (1 year)
Type : Bearish
Timeframe : Weekly
Near a new LOW record (1st january)
Type : Bearish
Timeframe : Weekly
Near a new LOW record (1 month)
Type : Bearish
Timeframe : Weekly
Technical
Technical analysis of this Daily chart of SMARTPHOTO GROUP indicates that the overall trend is strongly bearish. 89.29% of the signals given by moving averages are bearish. The overall trend is supported by the strong bearish signals from short-term moving averages. The Central Indicators market scanner currently does not detect any result that concerns moving averages.
An assessment of technical indicators does not currently provide any relevant information to suggest whether the signal given by the technical indicators is more bullish or bearish.
Caution: the Central Indicators scanner currently detects an excess:
CCI indicator: bullish divergence
Type : Bullish
Timeframe : Daily
MACD indicator: bullish divergence
Type : Bullish
Timeframe : Daily
RSI indicator: bullish divergence
Type : Bullish
Timeframe : Daily
Pivot points : price is over resistance 1
Type : Neutral
Timeframe : Daily
Momentum indicator is back over 0
Type : Bullish
Timeframe : Daily
No signals are given by Central Patterns, a market scanner specialised in chart patterns, resistances and supports.
The Central Candlesticks scanner, specialised in Japanese candlesticks, did not identify any signals.
| S3 | S2 | S1 | Price | R1 | R2 | R3 | |
|---|---|---|---|---|---|---|---|
| ProTrendLines | 5.2 | 9.2 | 16.5 | 23.5 | 24.0 | 24.6 | 27.2 |
| Change (%) | -77.87% | -60.85% | -29.79% | - | +2.13% | +4.68% | +15.74% |
| Change | -18.3 | -14.3 | -7.0 | - | +0.5 | +1.1 | +3.7 |
| Level | Minor | Minor | Intermediate | - | Intermediate | Major | Major |
Attention could also be paid to pivot points to set price objectives:
| Pivot points | S3 | S2 | S1 | PP | R1 | R2 | R3 |
|---|---|---|---|---|---|---|---|
| Standard | 21.4 | 22.0 | 22.2 | 22.8 | 23.0 | 23.6 | 23.8 |
| Camarilla | 22.3 | 22.4 | 22.4 | 22.5 | 22.6 | 22.7 | 22.7 |
| Woodie | 21.3 | 21.9 | 22.1 | 22.7 | 22.9 | 23.5 | 23.7 |
| Fibonacci | 22.0 | 22.3 | 22.5 | 22.8 | 23.1 | 23.3 | 23.6 |
| Pivot points | S3 | S2 | S1 | PP | R1 | R2 | R3 |
|---|---|---|---|---|---|---|---|
| Standard | 21.4 | 22.4 | 22.8 | 23.8 | 24.2 | 25.2 | 25.6 |
| Camarilla | 22.9 | 23.0 | 23.2 | 23.3 | 23.4 | 23.6 | 23.7 |
| Woodie | 21.2 | 22.3 | 22.6 | 23.7 | 24.0 | 25.1 | 25.4 |
| Fibonacci | 22.4 | 22.9 | 23.2 | 23.8 | 24.3 | 24.6 | 25.2 |
| Pivot points | S3 | S2 | S1 | PP | R1 | R2 | R3 |
|---|---|---|---|---|---|---|---|
| Standard | 17.0 | 19.8 | 21.8 | 24.6 | 26.6 | 29.4 | 31.4 |
| Camarilla | 22.6 | 23.0 | 23.5 | 23.9 | 24.3 | 24.8 | 25.2 |
| Woodie | 16.7 | 19.6 | 21.5 | 24.4 | 26.3 | 29.2 | 31.1 |
| Fibonacci | 19.8 | 21.6 | 22.7 | 24.6 | 26.4 | 27.5 | 29.4 |
Numerical data
The following are the details of the technical indicators and moving averages that were collected to generate this technical analysis:
| RSI (14): | 46.40 | |
| MACD (12,26,9): | -0.3000 | |
| Directional Movement: | -11.4 | |
| AROON (14): | 42.9 | |
| DEMA (21): | 23.4 | |
| Parabolic SAR (0,02-0,02-0,2): | 25.1 | |
| Elder Ray (13): | -0.3 | |
| Super Trend (3,10): | 25.1 | |
| Zig ZAG (10): | 23.5 | |
| VORTEX (21): | 0.8000 | |
| Stochastique (14,3,5): | 25.00 | |
| TEMA (21): | 23.2 | |
| Williams %R (14): | -58.30 | |
| Chande Momentum Oscillator (20): | 1.0 | |
| Repulse (5,40,3): | -1.7000 | |
| ROCnROLL: | 2 | |
| TRIX (15,9): | -0.2000 | |
| Courbe Coppock: | 2.70 |
| MA7: | 23.7 | |
| MA20: | 23.8 | |
| MA50: | 24.4 | |
| MA100: | 24.4 | |
| MAexp7: | 23.5 | |
| MAexp20: | 23.8 | |
| MAexp50: | 24.2 | |
| MAexp100: | 24.7 | |
| Price / MA7: | -0.84% | |
| Price / MA20: | -1.26% | |
| Price / MA50: | -3.69% | |
| Price / MA100: | -3.69% | |
| Price / MAexp7: | -0% | |
| Price / MAexp20: | -1.26% | |
| Price / MAexp50: | -2.89% | |
| Price / MAexp100: | -4.86% |
News
The latest news and videos published on SMARTPHOTO GROUP at the time of the analysis were as follows:
About author
Online


Add a comment
Comments
0 comments on the analysis SMARTPHOTO GROUP - Daily