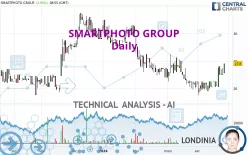
SMARTPHOTO GROUP - Daily - Technical analysis published on 04/26/2024 (GMT)
- 134
- 0
Click here for a new analysis!
- Timeframe : Daily
- - Analysis generated on
- Status : INVALID

Summary of the analysis

Additional analysis
Quotes
SMARTPHOTO GROUP rating 27.8 EUR. The price has increased by +2.96% since the last closing with the lowest point at 27.1 EUR and the highest point at 27.8 EUR. The deviation from the price is +2.58% for the low point and 0% for the high point.A bullish opening was detected by the Central Gaps scanner. Buyers are trying to impose a bullish momentum in the very short term.
Bullish opening
Type : Bullish
Timeframe : Openning
So that you have an overall view of the price change, here is a table showing the variations over several periods:
Near a new HIGH record (1 month)
Type : Bullish
Timeframe : Weekly
Technical
Technical analysis of SMARTPHOTO GROUP in Daily shows a neutral overall trend. This indecision could turn into a bullish trend due to the strong bullish signals currently being given by short-term moving averages. The Central Indicators market scanner is currently detecting several bullish signals that could impact this trend:
Bullish price crossover with adaptative moving average 50
Type : Bullish
Timeframe : Daily
Bullish price crossover with adaptative moving average 100
Type : Bullish
Timeframe : Daily
In fact, according to the parameters integrated into the Central Analyzer system, 14 technical indicators out of 18 analysed are currently bullish. Caution: the Central Indicators scanner currently detects an excess:
CCI indicator is overbought : over 100
Type : Neutral
Timeframe : Daily
Williams %R indicator is overbought : over -20
Type : Neutral
Timeframe : Daily
Pivot points : price is over resistance 2
Type : Neutral
Timeframe : Daily
Pivot points : price is over resistance 3
Type : Neutral
Timeframe : Weekly
SuperTrend indicator bullish reversal
Type : Bullish
Timeframe : Daily
Central Patterns, the scanner specializing in chart patterns, did not identify any signals.
No result was found by the Central Candlesticks scanner on Japanese candlesticks.
| S3 | S2 | S1 | Price | R1 | R2 | R3 | |
|---|---|---|---|---|---|---|---|
| ProTrendLines | 25.5 | 26.5 | 27.3 | 27.8 | 28.0 | 29.1 | 30.2 |
| Change (%) | -8.27% | -4.68% | -1.80% | - | +0.72% | +4.68% | +8.63% |
| Change | -2.3 | -1.3 | -0.5 | - | +0.2 | +1.3 | +2.4 |
| Level | Minor | Intermediate | Major | - | Major | Minor | Intermediate |
To determine price objectives, it is also possible to use the pivot points. Here is the price position in relation to pivot points:
| Pivot points | S3 | S2 | S1 | PP | R1 | R2 | R3 |
|---|---|---|---|---|---|---|---|
| Standard | 26.3 | 26.7 | 26.8 | 27.2 | 27.3 | 27.7 | 27.8 |
| Camarilla | 26.9 | 26.9 | 27.0 | 27.0 | 27.1 | 27.1 | 27.1 |
| Woodie | 26.3 | 26.6 | 26.8 | 27.1 | 27.3 | 27.6 | 27.8 |
| Fibonacci | 26.7 | 26.9 | 27.0 | 27.2 | 27.4 | 27.5 | 27.7 |
| Pivot points | S3 | S2 | S1 | PP | R1 | R2 | R3 |
|---|---|---|---|---|---|---|---|
| Standard | 25.6 | 25.9 | 26.0 | 26.3 | 26.4 | 26.7 | 26.8 |
| Camarilla | 26.1 | 26.1 | 26.2 | 26.2 | 26.2 | 26.3 | 26.3 |
| Woodie | 25.6 | 25.9 | 26.0 | 26.3 | 26.4 | 26.7 | 26.8 |
| Fibonacci | 25.9 | 26.0 | 26.1 | 26.3 | 26.4 | 26.5 | 26.7 |
| Pivot points | S3 | S2 | S1 | PP | R1 | R2 | R3 |
|---|---|---|---|---|---|---|---|
| Standard | 22.8 | 24.4 | 25.4 | 27.0 | 28.0 | 29.6 | 30.6 |
| Camarilla | 25.8 | 26.0 | 26.3 | 26.5 | 26.7 | 27.0 | 27.2 |
| Woodie | 22.6 | 24.3 | 25.2 | 26.9 | 27.8 | 29.5 | 30.4 |
| Fibonacci | 24.4 | 25.4 | 26.0 | 27.0 | 28.0 | 28.6 | 29.6 |
Numerical data
The following is the status of technical indicators and moving averages registered at the time this technical analysis was created:
| RSI (14): | 62.50 | |
| MACD (12,26,9): | 0.1000 | |
| Directional Movement: | 11.9 | |
| AROON (14): | 78.6 | |
| DEMA (21): | 26.8 | |
| Parabolic SAR (0,02-0,02-0,2): | 25.9 | |
| Elder Ray (13): | 0.6 | |
| Super Trend (3,10): | 25.7 | |
| Zig ZAG (10): | 27.8 | |
| VORTEX (21): | 1.0000 | |
| Stochastique (14,3,5): | 77.80 | |
| TEMA (21): | 27.1 | |
| Williams %R (14): | 0.00 | |
| Chande Momentum Oscillator (20): | 1.5 | |
| Repulse (5,40,3): | 2.7000 | |
| ROCnROLL: | 1 | |
| TRIX (15,9): | -0.1000 | |
| Courbe Coppock: | 6.30 |
| MA7: | 27.0 | |
| MA20: | 26.5 | |
| MA50: | 26.9 | |
| MA100: | 28.2 | |
| MAexp7: | 27.1 | |
| MAexp20: | 26.8 | |
| MAexp50: | 27.1 | |
| MAexp100: | 27.5 | |
| Price / MA7: | +2.96% | |
| Price / MA20: | +4.91% | |
| Price / MA50: | +3.35% | |
| Price / MA100: | -1.42% | |
| Price / MAexp7: | +2.58% | |
| Price / MAexp20: | +3.73% | |
| Price / MAexp50: | +2.58% | |
| Price / MAexp100: | +1.09% |
News
The latest news and videos published on SMARTPHOTO GROUP at the time of the analysis were as follows:
About author
Online


Add a comment
Comments
0 comments on the analysis SMARTPHOTO GROUP - Daily