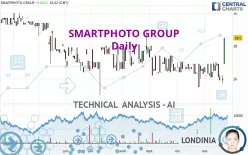
SMARTPHOTO GROUP - Daily - Technical analysis published on 11/21/2023 (GMT)
- 140
- 0
Click here for a new analysis!
- Timeframe : Daily
- - Analysis generated on
- Status : TARGET REACHED

Summary of the analysis

Additional analysis
Quotes
The SMARTPHOTO GROUP price is 28.5 EUR. On the day, this instrument gained +9.62% and was traded between 26.9 EUR and 28.5 EUR over the period. The price is currently at +5.95% from its lowest and 0% from its highest.The Central Gaps scanner detects a bullish gap which is a sign that buyers have taken the lead in the very short term.
Opening Gap UP
Type : Bullish
Timeframe : Openning
So that you have an overall view of the price change, here is a table showing the variations over several periods:
New HIGH record (1 month)
Type : Bullish
Timeframe : Weekly
Technical
A technical analysis in Daily of this SMARTPHOTO GROUP chart shows a bullish trend. The signals returned by the moving averages are 71.43% bullish. This bullish trend is reinforced by the strong signals currently being given by short-term moving averages. The Central Indicators market scanner is currently detecting several bullish signals that could impact this trend:
Bullish price crossover with Moving Average 20
Type : Bullish
Timeframe : Daily
Bullish price crossover with Moving Average 50
Type : Bullish
Timeframe : Daily
Bullish price crossover with Moving Average 100
Type : Bullish
Timeframe : Daily
Bullish price crossover with adaptative moving average 20
Type : Bullish
Timeframe : Daily
Bullish price crossover with adaptative moving average 50
Type : Bullish
Timeframe : Daily
Bullish price crossover with adaptative moving average 100
Type : Bullish
Timeframe : Daily
In fact, according to the parameters integrated into the Central Analyzer system, 14 technical indicators out of 18 analysed are currently bullish. But beware of excesses. The Central Indicators scanner currently detects this:
CCI indicator is overbought : over 100
Type : Neutral
Timeframe : Daily
CCI indicator: bullish divergence
Type : Bullish
Timeframe : Daily
MACD indicator: bullish divergence
Type : Bullish
Timeframe : Daily
Williams %R indicator is overbought : over -20
Type : Neutral
Timeframe : Daily
Pivot points : price is over resistance 3
Type : Neutral
Timeframe : Daily
Pivot points : price is over resistance 3
Type : Neutral
Timeframe : Weekly
RSI indicator is back over 50
Type : Bullish
Timeframe : Daily
MACD crosses UP its Moving Average
Type : Bullish
Timeframe : Daily
Aroon indicator bullish trend
Type : Bullish
Timeframe : Daily
Ichimoku : price is over the cloud
Type : Bullish
Timeframe : Daily
SuperTrend indicator bullish reversal
Type : Bullish
Timeframe : Daily
MACD indicator is back over 0
Type : Bullish
Timeframe : Daily
Momentum indicator is back over 0
Type : Bullish
Timeframe : Daily
The Central Patterns scanner, which studies chart patterns, resistances and supports, has identified this signal:
Near resistance of channel
Type : Bearish
Timeframe : Daily
Central Candlesticks, the scanner specialised in Japanese candlesticks, detects these bullish signals that could support the hypothesis of a small rebound in the very short term:
Upside gap
Type : Bullish
Timeframe : Daily
White marubozu
Type : Bullish
Timeframe : Daily
Long white line
Type : Bullish
Timeframe : Daily
| S3 | S2 | S1 | Price | R1 | R2 | R3 | |
|---|---|---|---|---|---|---|---|
| ProTrendLines | 26.5 | 27.3 | 28.0 | 28.5 | 28.8 | 29.7 | 30.5 |
| Change (%) | -7.02% | -4.21% | -1.75% | - | +1.05% | +4.21% | +7.02% |
| Change | -2.0 | -1.2 | -0.5 | - | +0.3 | +1.2 | +2.0 |
| Level | Minor | Major | Major | - | Major | Intermediate | Minor |
To determine price objectives, it is also possible to use the pivot points. Here is the price position in relation to pivot points:
| Pivot points | S3 | S2 | S1 | PP | R1 | R2 | R3 |
|---|---|---|---|---|---|---|---|
| Standard | 25.8 | 26.4 | 27.4 | 28.0 | 29.0 | 29.6 | 30.6 |
| Camarilla | 28.1 | 28.2 | 28.4 | 28.5 | 28.7 | 28.8 | 28.9 |
| Woodie | 26.1 | 26.5 | 27.7 | 28.1 | 29.3 | 29.7 | 30.9 |
| Fibonacci | 26.4 | 27.0 | 27.4 | 28.0 | 28.6 | 29.0 | 29.6 |
| Pivot points | S3 | S2 | S1 | PP | R1 | R2 | R3 |
|---|---|---|---|---|---|---|---|
| Standard | 24.0 | 24.8 | 25.5 | 26.3 | 27.0 | 27.8 | 28.5 |
| Camarilla | 25.9 | 26.0 | 26.2 | 26.3 | 26.4 | 26.6 | 26.7 |
| Woodie | 24.1 | 24.8 | 25.6 | 26.3 | 27.1 | 27.8 | 28.6 |
| Fibonacci | 24.8 | 25.3 | 25.7 | 26.3 | 26.8 | 27.2 | 27.8 |
Numerical data
The following are the details of the technical indicators and moving averages that were collected to generate this technical analysis:
| RSI (14): | 64.90 | |
| MACD (12,26,9): | 0.1000 | |
| Directional Movement: | 18.8 | |
| AROON (14): | 7.1 | |
| DEMA (21): | 26.6 | |
| Parabolic SAR (0,02-0,02-0,2): | 25.7 | |
| Elder Ray (13): | 1.1 | |
| Super Trend (3,10): | 25.6 | |
| Zig ZAG (10): | 28.5 | |
| VORTEX (21): | 0.8000 | |
| Stochastique (14,3,5): | 50.10 | |
| TEMA (21): | 26.8 | |
| Williams %R (14): | 0.00 | |
| Chande Momentum Oscillator (20): | 2.3 | |
| Repulse (5,40,3): | 6.7000 | |
| ROCnROLL: | 1 | |
| TRIX (15,9): | 0.0000 | |
| Courbe Coppock: | 2.40 |
| MA7: | 26.6 | |
| MA20: | 26.5 | |
| MA50: | 26.6 | |
| MA100: | 26.9 | |
| MAexp7: | 26.8 | |
| MAexp20: | 26.6 | |
| MAexp50: | 26.7 | |
| MAexp100: | 27.0 | |
| Price / MA7: | +7.14% | |
| Price / MA20: | +7.55% | |
| Price / MA50: | +7.14% | |
| Price / MA100: | +5.95% | |
| Price / MAexp7: | +6.34% | |
| Price / MAexp20: | +7.14% | |
| Price / MAexp50: | +6.74% | |
| Price / MAexp100: | +5.56% |
News
The latest news and videos published on SMARTPHOTO GROUP at the time of the analysis were as follows:
About author
Online


Add a comment
Comments
0 comments on the analysis SMARTPHOTO GROUP - Daily