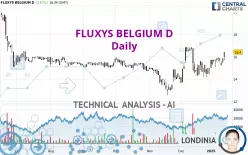
FLUXYS BELGIUM D - Daily - Technical analysis published on 01/16/2025 (GMT)
- 76
- 0
Click here for a new analysis!
- Timeframe : Daily
- - Analysis generated on
- Status : TARGET REACHED

Summary of the analysis

Additional analysis
Quotes
FLUXYS BELGIUM D rating 16.40 EUR. The price has increased by +3.47% since the last closing and was traded between 15.65 EUR and 16.40 EUR over the period. The price is currently at +4.79% from its lowest and 0% from its highest.A bullish gap was detected at the opening by the Central Gaps scanner. There are a lot of buyers and they have the upper hand in the very short term.
Opening Gap UP
Type : Bullish
Timeframe : Openning
A study of price movements over other periods shows the following variations:
New HIGH record (1st january)
Type : Bullish
Timeframe : Weekly
New HIGH record (1 month)
Type : Bullish
Timeframe : Weekly
Technical
A technical analysis in Daily of this FLUXYS BELGIUM D chart shows a strongly bullish trend. The signals given by the moving averages are 85.71% bullish. This strong bullish trend is confirmed by the strong signals currently being given by short-term moving averages. The Central Indicators scanner detects a bullish signal on moving averages that could impact this trend:
Bullish trend reversal : Moving Average 20
Type : Bullish
Timeframe : Daily
In fact, 14 technical indicators on 18 studied are currently bullish. Caution: the Central Indicators scanner currently detects an excess:
CCI indicator is overbought : over 100
Type : Neutral
Timeframe : Daily
Williams %R indicator is overbought : over -20
Type : Neutral
Timeframe : Daily
Pivot points : price is over resistance 1
Type : Neutral
Timeframe : Weekly
Pivot points : price is over resistance 2
Type : Neutral
Timeframe : Daily
Ichimoku - Bullish crossover : Tenkan & Kijun
Type : Bullish
Timeframe : Daily
Central Patterns, the market scanner focusing on chart patterns, resistances and supports found these results:
Near horizontal resistance
Type : Bearish
Timeframe : Daily
Resistance of channel is broken
Type : Bullish
Timeframe : Daily
Resistance of triangle is broken
Type : Bullish
Timeframe : Daily
The Central Candlesticks scanner which studies Japanese candlesticks did not detect anything.
| S3 | S2 | S1 | Price | R1 | R2 | R3 | |
|---|---|---|---|---|---|---|---|
| ProTrendLines | 13.00 | 14.30 | 15.88 | 16.40 | 16.80 | 19.32 | 20.55 |
| Change (%) | -20.73% | -12.80% | -3.17% | - | +2.44% | +17.80% | +25.30% |
| Change | -3.40 | -2.10 | -0.52 | - | +0.40 | +2.92 | +4.15 |
| Level | Minor | Minor | Major | - | Major | Intermediate | Minor |
To determine price objectives, it is also possible to use the pivot points. Here is the price position in relation to pivot points:
| Pivot points | S3 | S2 | S1 | PP | R1 | R2 | R3 |
|---|---|---|---|---|---|---|---|
| Standard | 15.15 | 15.40 | 15.90 | 16.15 | 16.65 | 16.90 | 17.40 |
| Camarilla | 16.19 | 16.26 | 16.33 | 16.40 | 16.47 | 16.54 | 16.61 |
| Woodie | 15.28 | 15.46 | 16.03 | 16.21 | 16.78 | 16.96 | 17.53 |
| Fibonacci | 15.40 | 15.69 | 15.86 | 16.15 | 16.44 | 16.61 | 16.90 |
| Pivot points | S3 | S2 | S1 | PP | R1 | R2 | R3 |
|---|---|---|---|---|---|---|---|
| Standard | 14.45 | 14.75 | 15.30 | 15.60 | 16.15 | 16.45 | 17.00 |
| Camarilla | 15.62 | 15.69 | 15.77 | 15.85 | 15.93 | 16.01 | 16.08 |
| Woodie | 14.58 | 14.81 | 15.43 | 15.66 | 16.28 | 16.51 | 17.13 |
| Fibonacci | 14.75 | 15.08 | 15.28 | 15.60 | 15.93 | 16.13 | 16.45 |
| Pivot points | S3 | S2 | S1 | PP | R1 | R2 | R3 |
|---|---|---|---|---|---|---|---|
| Standard | 10.20 | 11.90 | 13.45 | 15.15 | 16.70 | 18.40 | 19.95 |
| Camarilla | 14.11 | 14.40 | 14.70 | 15.00 | 15.30 | 15.60 | 15.89 |
| Woodie | 10.13 | 11.86 | 13.38 | 15.11 | 16.63 | 18.36 | 19.88 |
| Fibonacci | 11.90 | 13.14 | 13.91 | 15.15 | 16.39 | 17.16 | 18.40 |
Numerical data
The following are the details of the technical indicators and moving averages that were collected to generate this technical analysis:
| RSI (14): | 61.21 | |
| MACD (12,26,9): | 0.2800 | |
| Directional Movement: | 7.76 | |
| AROON (14): | 100.00 | |
| DEMA (21): | 15.84 | |
| Parabolic SAR (0,02-0,02-0,2): | 14.48 | |
| Elder Ray (13): | 0.38 | |
| Super Trend (3,10): | 16.80 | |
| Zig ZAG (10): | 16.40 | |
| VORTEX (21): | 1.0300 | |
| Stochastique (14,3,5): | 89.22 | |
| TEMA (21): | 15.99 | |
| Williams %R (14): | 0.00 | |
| Chande Momentum Oscillator (20): | 1.95 | |
| Repulse (5,40,3): | 8.5700 | |
| ROCnROLL: | 1 | |
| TRIX (15,9): | 0.2000 | |
| Courbe Coppock: | 13.19 |
| MA7: | 15.85 | |
| MA20: | 15.29 | |
| MA50: | 14.86 | |
| MA100: | 15.07 | |
| MAexp7: | 15.85 | |
| MAexp20: | 15.49 | |
| MAexp50: | 15.20 | |
| MAexp100: | 15.38 | |
| Price / MA7: | +3.47% | |
| Price / MA20: | +7.26% | |
| Price / MA50: | +10.36% | |
| Price / MA100: | +8.83% | |
| Price / MAexp7: | +3.47% | |
| Price / MAexp20: | +5.87% | |
| Price / MAexp50: | +7.89% | |
| Price / MAexp100: | +6.63% |
News
The last news published on FLUXYS BELGIUM D at the time of the generation of this analysis was as follows:
- Fluxys Belgium: Regulated information - Payment of dividend
- Fluxys hydrogen appointed as “Hydrogen Network Operator” in Belgium
- Fluxys Belgium - Regulated information: Ordinary general meeting 14th May 2024
- Fluxys Belgium – 8 April 2022 13:00 CET - Regulated information: ordinary and extraordinary general meetings on 10 May 2022
- Fluxys Belgium – 9 April 2021 11:00 CET - Regulated information: Ordinary General Meeting 11 May 2021
About author
Online


Add a comment
Comments
0 comments on the analysis FLUXYS BELGIUM D - Daily