Technical analyses - FLUXYS BELGIUM D - English
You are currently viewing all technical analyses of the financial instrument FLUXYS BELGIUM D regarding all markets in English regarding all markets, sorted by Latest comments.
Sort : Latest comments | Latest posted
FLUXYS BELGIUM D
> Analyses

 Thank you
Reply
Chart
Thank you
Reply
Chart
Londinia
has published a new analysis.
- 0
- 98320
- 16029
- 0
Timeframe : Daily - Simple chart
Status : TARGET REACHED
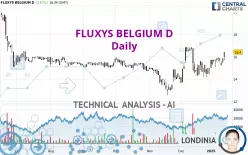
The bullish trend is currently very strong on FLUXYS BELGIUM D. As long as the price remains above the support at 15.88 EUR, you could try to benefit from the boom. The first bullish objective is…
FLUXYS BELGIUM D
> Analyses
 Thank you
Reply
Chart
Thank you
Reply
Chart
Londinia
has published a new analysis.
- 0
- 98320
- 16029
- 0
Timeframe : Daily - Simple chart
Status : LEVEL MAINTAINED
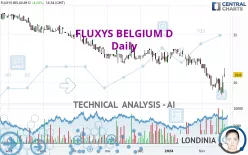
FLUXYS BELGIUM D is part of a very strong bearish trend. Traders may consider trading only short positions (for sale) as long as the price remains well below 17.05 EUR. The next support located at…
FLUXYS BELGIUM D
> Analyses
 Thank you
Reply
Chart
Thank you
Reply
Chart
Londinia
has published a new analysis.
- 0
- 98320
- 16029
- 0
Timeframe : Daily - Simple chart
Status : LEVEL MAINTAINED
We are currently in a phase of short-term indecision. In a case like this, you could favour trades in the direction of the basic trend on FLUXYS BELGIUM D. As long as you are under the resistance…
FLUXYS BELGIUM D
> Analyses
 Thank you
Reply
Chart
Thank you
Reply
Chart
Londinia
has published a new analysis.
- 0
- 98320
- 16029
- 0
Timeframe : Daily - Simple chart
Status : INVALID
Has the basic bearish trend slowed or is it lacking in power? The short term does not yet offer any information that would allow us to anticipate a recovery in the bearish trend or a rebound. Sellers'…
FLUXYS BELGIUM D
> Analyses
 Thank you
Reply
Chart
Thank you
Reply
Chart
Londinia
has published a new analysis.
- 0
- 98320
- 16029
- 0
Timeframe : Daily - Simple chart
Status : NEUTRAL
The basic trend is slightly bearish and the short term is tentatively bullish. With such a pattern, it is difficult to favour buying or selling. The first resistance is located at 24.8 EUR. The first…

