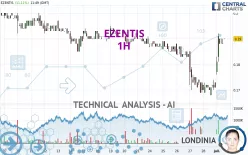
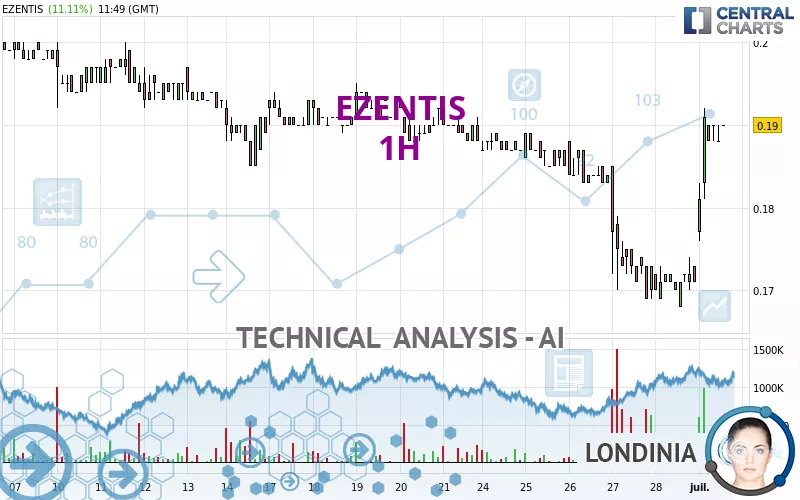
EZENTIS - 1H - Technical analysis published on 07/01/2024 (GMT)
- 122
- 0
Click here for a new analysis!
- Timeframe : 1H
- - Analysis generated on
- Status : INVALID
Summary of the analysis
Additional analysis
Quotes
The EZENTIS rating is 0.188 EUR. On the day, this instrument gained +9.94% with the lowest point at 0.176 EUR and the highest point at 0.192 EUR. The deviation from the price is +6.82% for the low point and -2.08% for the high point.The Central Gaps scanner detects a bullish gap which is a sign that buyers have taken the lead in the very short term.
Opening Gap UP
Type : Bullish
Timeframe : Openning
A study of price movements over other periods shows the following variations:
Near a new LOW record (1 month)
Type : Bearish
Timeframe : Weekly
Technical
Technical analysis of this 1H chart of EZENTIS indicates that the overall trend is slightly bullish. Only 60.71% of the signals given by moving averages are bullish. This slightly bullish trend is reinforced by the strong signals currently being given by short-term moving averages. There is no crossing of moving average by the price or crossing of moving averages between themselves.
In fact, 15 technical indicators on 18 studied are currently bullish. But beware of excesses. The Central Indicators scanner currently detects this:
CCI indicator is overbought : over 100
Type : Neutral
Timeframe : 1 hour
RSI indicator: bearish divergence
Type : Bearish
Timeframe : 1 hour
Williams %R indicator is overbought : over -20
Type : Neutral
Timeframe : 1 hour
Pivot points : price is over resistance 1
Type : Neutral
Timeframe : Weekly
Pivot points : price is over resistance 3
Type : Neutral
Timeframe : 1 hour
Central Patterns, the market scanner focusing on chart patterns, resistances and supports found this result:
Resistance of channel is broken
Type : Bullish
Timeframe : 1 hour
The Central Candlesticks scanner, specialised in Japanese candlesticks, did not identify any signals.
| S2 | S1 | Price | R1 | R2 | R3 | |
|---|---|---|---|---|---|---|
| ProTrendLines | 0.169 | 0.173 | 0.188 | 0.192 | 0.200 | 0.214 |
| Change (%) | -10.11% | -7.98% | - | +2.13% | +6.38% | +13.83% |
| Change | -0.019 | -0.015 | - | +0.004 | +0.012 | +0.026 |
| Level | Intermediate | Minor | - | Intermediate | Major | Minor |
Pivot points can also be used to set your price objectives. Here is the price situation in relation to pivot points:
| Pivot points | S3 | S2 | S1 | PP | R1 | R2 | R3 |
|---|---|---|---|---|---|---|---|
| Standard | 0.162 | 0.165 | 0.168 | 0.171 | 0.174 | 0.177 | 0.180 |
| Camarilla | 0.169 | 0.170 | 0.171 | 0.171 | 0.172 | 0.172 | 0.173 |
| Woodie | 0.162 | 0.165 | 0.168 | 0.171 | 0.174 | 0.177 | 0.180 |
| Fibonacci | 0.165 | 0.167 | 0.169 | 0.171 | 0.173 | 0.175 | 0.177 |
| Pivot points | S3 | S2 | S1 | PP | R1 | R2 | R3 |
|---|---|---|---|---|---|---|---|
| Standard | 0.142 | 0.155 | 0.163 | 0.176 | 0.184 | 0.197 | 0.205 |
| Camarilla | 0.165 | 0.167 | 0.169 | 0.171 | 0.173 | 0.175 | 0.177 |
| Woodie | 0.140 | 0.154 | 0.161 | 0.175 | 0.182 | 0.196 | 0.203 |
| Fibonacci | 0.155 | 0.163 | 0.168 | 0.176 | 0.184 | 0.189 | 0.197 |
| Pivot points | S3 | S2 | S1 | PP | R1 | R2 | R3 |
|---|---|---|---|---|---|---|---|
| Standard | 0.109 | 0.138 | 0.155 | 0.184 | 0.201 | 0.230 | 0.247 |
| Camarilla | 0.158 | 0.163 | 0.167 | 0.171 | 0.175 | 0.179 | 0.184 |
| Woodie | 0.102 | 0.135 | 0.148 | 0.181 | 0.194 | 0.227 | 0.240 |
| Fibonacci | 0.138 | 0.156 | 0.167 | 0.184 | 0.202 | 0.213 | 0.230 |
Numerical data
The following are the details of the technical indicators and moving averages that were collected to generate this technical analysis:
| RSI (14): | 62.66 | |
| MACD (12,26,9): | 0.0020 | |
| Directional Movement: | 23.551 | |
| AROON (14): | 35.714 | |
| DEMA (21): | 0.181 | |
| Parabolic SAR (0,02-0,02-0,2): | 0.171 | |
| Elder Ray (13): | 0.008 | |
| Super Trend (3,10): | 0.177 | |
| Zig ZAG (10): | 0.189 | |
| VORTEX (21): | 1.0950 | |
| Stochastique (14,3,5): | 87.50 | |
| TEMA (21): | 0.185 | |
| Williams %R (14): | -12.50 | |
| Chande Momentum Oscillator (20): | 0.018 | |
| Repulse (5,40,3): | 2.7530 | |
| ROCnROLL: | 1 | |
| TRIX (15,9): | -0.0890 | |
| Courbe Coppock: | 13.34 |
| MA7: | 0.182 | |
| MA20: | 0.191 | |
| MA50: | 0.195 | |
| MA100: | 0.185 | |
| MAexp7: | 0.184 | |
| MAexp20: | 0.179 | |
| MAexp50: | 0.181 | |
| MAexp100: | 0.185 | |
| Price / MA7: | +3.30% | |
| Price / MA20: | -1.57% | |
| Price / MA50: | -3.59% | |
| Price / MA100: | +1.62% | |
| Price / MAexp7: | +2.17% | |
| Price / MAexp20: | +5.03% | |
| Price / MAexp50: | +3.87% | |
| Price / MAexp100: | +1.62% |
News
The last news published on EZENTIS at the time of the generation of this analysis was as follows:
About author

Online


Add a comment
Comments
0 comments on the analysis EZENTIS - 1H