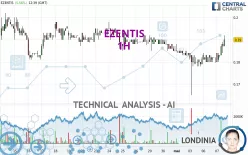
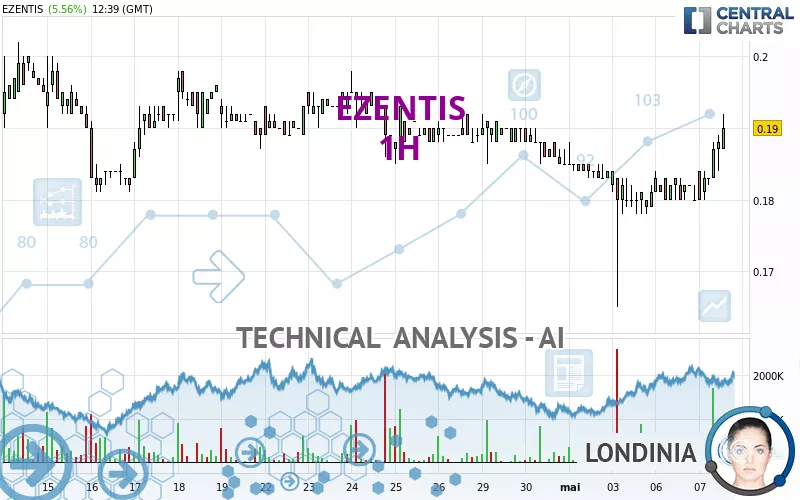
EZENTIS - 1H - Technical analysis published on 05/07/2024 (GMT)
- 124
- 0
Click here for a new analysis!
- Timeframe : 1H
- - Analysis generated on
- Status : TARGET REACHED
Summary of the analysis
Additional analysis
Quotes
The EZENTIS price is 0.188 EUR. The price has increased by +4.44% since the last closing and was between 0.180 EUR and 0.189 EUR. This implies that the price is at +4.44% from its lowest and at -0.53% from its highest.A bullish opening was detected by the Central Gaps scanner. Buyers are trying to impose a bullish momentum in the very short term.
Bullish opening
Type : Bullish
Timeframe : Openning
So that you have an overall view of the price change, here is a table showing the variations over several periods:
Abnormal volumes
Timeframe : 50 days
Technical
Technical analysis of EZENTIS in 1H shows an overall slightly bullish trend. 50.00% of the signals given by moving averages are bullish. This slightly bullish trend could be reinforced by the strong bullish signals given by short-term moving averages. The Central Indicators market scanner currently does not detect any result that concerns moving averages.
Technical indicators are strongly bullish, suggesting that the price increase should continue.
But beware of excesses. The Central Indicators scanner currently detects this:
CCI indicator is overbought : over 100
Type : Neutral
Timeframe : 1 hour
Previous candle closed over Bollinger bands
Type : Neutral
Timeframe : 1 hour
Williams %R indicator is overbought : over -20
Type : Neutral
Timeframe : 1 hour
Pivot points : price is over resistance 3
Type : Neutral
Timeframe : 1 hour
An analysis of the price chart with the Central Patterns scanner (detector of chart patterns and resistances and supports) shows several results that can have an impact on the price change:
Near horizontal resistance
Type : Bearish
Timeframe : 1 hour
Resistance of channel is broken
Type : Bullish
Timeframe : 1 hour
The Central Candlesticks scanner which studies Japanese candlesticks did not detect anything.
| S2 | S1 | Price | R1 | R2 | R3 | |
|---|---|---|---|---|---|---|
| ProTrendLines | 0.165 | 0.178 | 0.188 | 0.190 | 0.198 | 0.204 |
| Change (%) | -12.23% | -5.32% | - | +1.06% | +5.32% | +8.51% |
| Change | -0.023 | -0.010 | - | +0.002 | +0.010 | +0.016 |
| Level | Major | Minor | - | Intermediate | Intermediate | Minor |
Attention could also be paid to pivot points to set price objectives:
| Pivot points | S3 | S2 | S1 | PP | R1 | R2 | R3 |
|---|---|---|---|---|---|---|---|
| Standard | 0.175 | 0.177 | 0.179 | 0.181 | 0.183 | 0.185 | 0.187 |
| Camarilla | 0.179 | 0.179 | 0.180 | 0.180 | 0.180 | 0.181 | 0.181 |
| Woodie | 0.174 | 0.177 | 0.178 | 0.181 | 0.182 | 0.185 | 0.186 |
| Fibonacci | 0.177 | 0.179 | 0.180 | 0.181 | 0.183 | 0.184 | 0.185 |
| Pivot points | S3 | S2 | S1 | PP | R1 | R2 | R3 |
|---|---|---|---|---|---|---|---|
| Standard | 0.140 | 0.152 | 0.167 | 0.179 | 0.194 | 0.206 | 0.221 |
| Camarilla | 0.174 | 0.176 | 0.179 | 0.181 | 0.184 | 0.186 | 0.188 |
| Woodie | 0.141 | 0.153 | 0.168 | 0.180 | 0.195 | 0.207 | 0.222 |
| Fibonacci | 0.152 | 0.163 | 0.169 | 0.179 | 0.190 | 0.196 | 0.206 |
| Pivot points | S3 | S2 | S1 | PP | R1 | R2 | R3 |
|---|---|---|---|---|---|---|---|
| Standard | 0.132 | 0.154 | 0.169 | 0.191 | 0.206 | 0.228 | 0.243 |
| Camarilla | 0.175 | 0.178 | 0.182 | 0.185 | 0.188 | 0.192 | 0.195 |
| Woodie | 0.130 | 0.152 | 0.167 | 0.189 | 0.204 | 0.226 | 0.241 |
| Fibonacci | 0.154 | 0.168 | 0.177 | 0.191 | 0.205 | 0.214 | 0.228 |
Numerical data
The following are the details of the technical indicators and moving averages that were collected to generate this technical analysis:
| RSI (14): | 63.36 | |
| MACD (12,26,9): | 0.0010 | |
| Directional Movement: | 8.757 | |
| AROON (14): | 78.571 | |
| DEMA (21): | 0.184 | |
| Parabolic SAR (0,02-0,02-0,2): | 0.175 | |
| Elder Ray (13): | 0.004 | |
| Super Trend (3,10): | 0.179 | |
| Zig ZAG (10): | 0.188 | |
| VORTEX (21): | 1.1190 | |
| Stochastique (14,3,5): | 88.89 | |
| TEMA (21): | 0.185 | |
| Williams %R (14): | -11.11 | |
| Chande Momentum Oscillator (20): | 0.008 | |
| Repulse (5,40,3): | 2.7290 | |
| ROCnROLL: | 1 | |
| TRIX (15,9): | -0.0390 | |
| Courbe Coppock: | 4.14 |
| MA7: | 0.185 | |
| MA20: | 0.190 | |
| MA50: | 0.180 | |
| MA100: | 0.151 | |
| MAexp7: | 0.185 | |
| MAexp20: | 0.183 | |
| MAexp50: | 0.185 | |
| MAexp100: | 0.186 | |
| Price / MA7: | +1.62% | |
| Price / MA20: | -1.05% | |
| Price / MA50: | +4.44% | |
| Price / MA100: | +24.50% | |
| Price / MAexp7: | +1.62% | |
| Price / MAexp20: | +2.73% | |
| Price / MAexp50: | +1.62% | |
| Price / MAexp100: | +1.08% |
News
The last news published on EZENTIS at the time of the generation of this analysis was as follows:
About author

Online


Add a comment
Comments
0 comments on the analysis EZENTIS - 1H