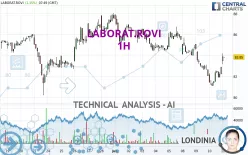
LABORAT.ROVI - 1H - Technical analysis published on 07/11/2024 (GMT)
- 127
- 0
- Timeframe : 1H
- - Analysis generated on
- Status : NEUTRAL

Summary of the analysis

Additional analysis
Quotes
LABORAT.ROVI rating 84.15 EUR. The price registered an increase of +1.51% on the session and was traded between 83.15 EUR and 84.20 EUR over the period. The price is currently at +1.20% from its lowest and -0.06% from its highest.The Central Gaps scanner detects the formation of a bullish gap marking the strong presence of buyers against sellers at the opening. This formed a quotation gap.
Opening Gap UP
Type : Bullish
Timeframe : Openning
A study of price movements over other periods shows the following variations:
Near a new LOW record (1 month)
Type : Bearish
Timeframe : Weekly
Technical
Technical analysis of LABORAT.ROVI in 1H shows a neutral overall trend. The slightly bullish signals currently given by short-term moving averages could allow the overall trend to return to a slightly bullish trend. The Central Indicators market scanner is currently detecting several bullish signals that could impact this trend:
Bullish trend reversal : adaptative moving average 20
Type : Bullish
Timeframe : 1 hour
Bullish price crossover with adaptative moving average 50
Type : Bullish
Timeframe : 1 hour
An assessment of technical indicators shows a moderate bullish signal.
Caution: the Central Indicators scanner currently detects an excess:
Williams %R indicator is overbought : over -20
Type : Neutral
Timeframe : 1 hour
Pivot points : price is over resistance 1
Type : Neutral
Timeframe : 1 hour
Pivot points : price is under support 1
Type : Neutral
Timeframe : Weekly
RSI indicator is back over 50
Type : Bullish
Timeframe : 1 hour
Aroon indicator bullish trend
Type : Bullish
Timeframe : 1 hour
Momentum indicator is back over 0
Type : Bullish
Timeframe : 1 hour
Central Patterns, the market scanner focusing on chart patterns, resistances and supports found this result:
Near resistance of channel
Type : Bearish
Timeframe : 1 hour
Central Candlesticks, the scanner specialised in Japanese candlesticks, detects a bullish signal that could support the hypothesis of a small rebound in the very short term:
Upside gap
Type : Bullish
Timeframe : 1 hour
| S3 | S2 | S1 | Price | R1 | R2 | R3 | |
|---|---|---|---|---|---|---|---|
| ProTrendLines | 80.20 | 81.10 | 82.73 | 84.15 | 85.08 | 86.77 | 87.62 |
| Change (%) | -4.69% | -3.62% | -1.69% | - | +1.11% | +3.11% | +4.12% |
| Change | -3.95 | -3.05 | -1.42 | - | +0.93 | +2.62 | +3.47 |
| Level | Intermediate | Minor | Intermediate | - | Minor | Intermediate | Intermediate |
To determine price objectives, it is also possible to use the pivot points. Here is the price position in relation to pivot points:
| Pivot points | S3 | S2 | S1 | PP | R1 | R2 | R3 |
|---|---|---|---|---|---|---|---|
| Standard | 79.90 | 80.50 | 81.70 | 82.30 | 83.50 | 84.10 | 85.30 |
| Camarilla | 82.41 | 82.57 | 82.74 | 82.90 | 83.07 | 83.23 | 83.40 |
| Woodie | 80.20 | 80.65 | 82.00 | 82.45 | 83.80 | 84.25 | 85.60 |
| Fibonacci | 80.50 | 81.19 | 81.61 | 82.30 | 82.99 | 83.41 | 84.10 |
| Pivot points | S3 | S2 | S1 | PP | R1 | R2 | R3 |
|---|---|---|---|---|---|---|---|
| Standard | 80.47 | 82.43 | 83.97 | 85.93 | 87.47 | 89.43 | 90.97 |
| Camarilla | 84.54 | 84.86 | 85.18 | 85.50 | 85.82 | 86.14 | 86.46 |
| Woodie | 80.25 | 82.33 | 83.75 | 85.83 | 87.25 | 89.33 | 90.75 |
| Fibonacci | 82.43 | 83.77 | 84.60 | 85.93 | 87.27 | 88.10 | 89.43 |
| Pivot points | S3 | S2 | S1 | PP | R1 | R2 | R3 |
|---|---|---|---|---|---|---|---|
| Standard | 71.03 | 75.62 | 81.58 | 86.17 | 92.13 | 96.72 | 102.68 |
| Camarilla | 84.65 | 85.62 | 86.58 | 87.55 | 88.52 | 89.48 | 90.45 |
| Woodie | 71.73 | 75.96 | 82.28 | 86.51 | 92.83 | 97.06 | 103.38 |
| Fibonacci | 75.62 | 79.65 | 82.14 | 86.17 | 90.20 | 92.69 | 96.72 |
Numerical data
The following is the status of the technical indicators and moving averages at the time of publication of this technical analysis:
| RSI (14): | 57.73 | |
| MACD (12,26,9): | -0.4700 | |
| Directional Movement: | 5.60 | |
| AROON (14): | 50.00 | |
| DEMA (21): | 82.13 | |
| Parabolic SAR (0,02-0,02-0,2): | 81.25 | |
| Elder Ray (13): | 0.89 | |
| Super Trend (3,10): | 81.71 | |
| Zig ZAG (10): | 83.90 | |
| VORTEX (21): | 0.9100 | |
| Stochastique (14,3,5): | 80.39 | |
| TEMA (21): | 82.21 | |
| Williams %R (14): | 0.00 | |
| Chande Momentum Oscillator (20): | 1.15 | |
| Repulse (5,40,3): | 1.8200 | |
| ROCnROLL: | -1 | |
| TRIX (15,9): | -0.1300 | |
| Courbe Coppock: | 2.23 |
| MA7: | 84.14 | |
| MA20: | 85.05 | |
| MA50: | 86.28 | |
| MA100: | 82.43 | |
| MAexp7: | 82.70 | |
| MAexp20: | 82.86 | |
| MAexp50: | 83.82 | |
| MAexp100: | 84.60 | |
| Price / MA7: | +0.01% | |
| Price / MA20: | -1.06% | |
| Price / MA50: | -2.47% | |
| Price / MA100: | +2.09% | |
| Price / MAexp7: | +1.75% | |
| Price / MAexp20: | +1.56% | |
| Price / MAexp50: | +0.39% | |
| Price / MAexp100: | -0.53% |
News
The latest news and videos published on LABORAT.ROVI at the time of the analysis were as follows:
- Laboratorios Farmacéuticos ROVI (ROVI): All good things come in threes
- Edison Investment Research Limited: Edison issues outlook on Laboratorios Farmacéuticos ROVI (ROVI)
About author
Online


Add a comment
Comments
0 comments on the analysis LABORAT.ROVI - 1H