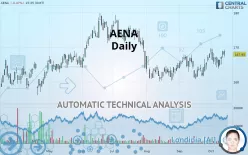
AENA - Daily - Technical analysis published on 10/15/2019 (GMT)
- 277
- 0
- Who voted?
Click here for a new analysis!
- Timeframe : Daily
- - Analysis generated on
- Status : TARGET REACHED

Summary of the analysis

Additional analysis
Quotes
The AENA price is 167.95 EUR. The price registered a decrease of -0.47% on the session and was between 167.25 EUR and 169.30 EUR. This implies that the price is at +0.42% from its lowest and at -0.80% from its highest.A study of price movements over other periods shows the following variations:
Technical
Technical analysis of this Daily chart of AENA indicates that the overall trend is strongly bullish. 82.14% of the signals given by moving averages are bullish. This strongly bullish trend is supported by the strong bullish signals given by short-term moving averages. The Central Indicators market scanner is currently detecting several bullish signals that could impact this trend:
Bullish price crossover with Moving Average 100
Type : Bullish
Timeframe : Daily
Bullish price crossover with adaptative moving average 50
Type : Bullish
Timeframe : Daily
In fact, 13 technical indicators on 18 studied are currently bullish. But beware of excesses. The Central Indicators scanner currently detects this:
CCI indicator is overbought : over 100
Type : Neutral
Timeframe : Daily
Williams %R indicator is overbought : over -20
Type : Neutral
Timeframe : Daily
Price is back over the pivot point
Type : Bullish
Timeframe : Daily
Price is back over the pivot point
Type : Bullish
Timeframe : Weekly
An analysis of the price chart with the Central Patterns scanner (detector of chart patterns and resistances and supports) shows a result that can have an impact on the price change:
Near resistance of triangle
Type : Bearish
Timeframe : Daily
No result was found by the Central Candlesticks scanner on Japanese candlesticks.
| S3 | S2 | S1 | Price | R1 | R2 | |
|---|---|---|---|---|---|---|
| ProTrendLines | 147.60 | 160.60 | 166.07 | 167.95 | 171.35 | 179.38 |
| Change (%) | -12.12% | -4.38% | -1.12% | - | +2.02% | +6.81% |
| Change | -20.35 | -7.35 | -1.88 | - | +3.40 | +11.43 |
| Level | Minor | Major | Major | - | Intermediate | Major |
Pivot points can also be used to set your price objectives. Here is the price situation in relation to pivot points:
| Pivot points | S3 | S2 | S1 | PP | R1 | R2 | R3 |
|---|---|---|---|---|---|---|---|
| Standard | 165.37 | 166.18 | 167.47 | 168.28 | 169.57 | 170.38 | 171.67 |
| Camarilla | 168.17 | 168.37 | 168.56 | 168.75 | 168.94 | 169.14 | 169.33 |
| Woodie | 165.60 | 166.30 | 167.70 | 168.40 | 169.80 | 170.50 | 171.90 |
| Fibonacci | 166.18 | 166.99 | 167.48 | 168.28 | 169.09 | 169.58 | 170.38 |
| Pivot points | S3 | S2 | S1 | PP | R1 | R2 | R3 |
|---|---|---|---|---|---|---|---|
| Standard | 159.95 | 161.85 | 165.30 | 167.20 | 170.65 | 172.55 | 176.00 |
| Camarilla | 167.28 | 167.77 | 168.26 | 168.75 | 169.24 | 169.73 | 170.22 |
| Woodie | 160.73 | 162.24 | 166.08 | 167.59 | 171.43 | 172.94 | 176.78 |
| Fibonacci | 161.85 | 163.89 | 165.16 | 167.20 | 169.24 | 170.51 | 172.55 |
| Pivot points | S3 | S2 | S1 | PP | R1 | R2 | R3 |
|---|---|---|---|---|---|---|---|
| Standard | 155.62 | 158.23 | 163.12 | 165.73 | 170.62 | 173.23 | 178.12 |
| Camarilla | 165.94 | 166.63 | 167.31 | 168.00 | 168.69 | 169.38 | 170.06 |
| Woodie | 156.75 | 158.80 | 164.25 | 166.30 | 171.75 | 173.80 | 179.25 |
| Fibonacci | 158.23 | 161.10 | 162.87 | 165.73 | 168.60 | 170.37 | 173.23 |
Numerical data
The following are the details of the technical indicators and moving averages that were collected to generate this technical analysis:
| RSI (14): | 56.26 | |
| MACD (12,26,9): | 0.6900 | |
| Directional Movement: | 7.19 | |
| AROON (14): | 35.71 | |
| DEMA (21): | 166.95 | |
| Parabolic SAR (0,02-0,02-0,2): | 163.75 | |
| Elder Ray (13): | 1.68 | |
| Super Trend (3,10): | 162.14 | |
| Zig ZAG (10): | 167.95 | |
| VORTEX (21): | 1.0500 | |
| Stochastique (14,3,5): | 76.52 | |
| TEMA (21): | 167.77 | |
| Williams %R (14): | -26.47 | |
| Chande Momentum Oscillator (20): | 2.50 | |
| Repulse (5,40,3): | 0.3700 | |
| ROCnROLL: | 1 | |
| TRIX (15,9): | 0.0400 | |
| Courbe Coppock: | 3.68 |
| MA7: | 166.71 | |
| MA20: | 165.66 | |
| MA50: | 164.51 | |
| MA100: | 168.41 | |
| MAexp7: | 167.14 | |
| MAexp20: | 166.18 | |
| MAexp50: | 165.97 | |
| MAexp100: | 165.08 | |
| Price / MA7: | +0.74% | |
| Price / MA20: | +1.38% | |
| Price / MA50: | +2.09% | |
| Price / MA100: | -0.27% | |
| Price / MAexp7: | +0.48% | |
| Price / MAexp20: | +1.07% | |
| Price / MAexp50: | +1.19% | |
| Price / MAexp100: | +1.74% |
News
The latest news and videos published on AENA at the time of the analysis were as follows:
- Smiths Detection’s Largest Ever Order for HBS Systems Confirmed by Spanish Airport Operator, Aena
-
 Aena
Aena
About author

Online


Add a comment
Comments
0 comments on the analysis AENA - Daily