AENA - 1H - Technical analysis published on 03/04/2025 (GMT)
- 57
- 0
Click here for a new analysis!
- Timeframe : 1H
- - Analysis generated on
- Status : TARGET REACHED
Summary of the analysis

Additional analysis
Quotes
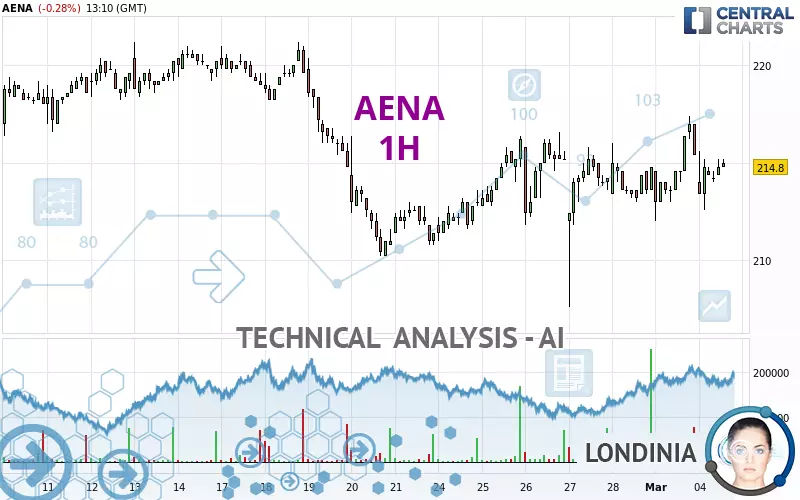
The AENA price is 214.8 EUR. On the day, this instrument lost -0.28% with the lowest point at 212.6 EUR and the highest point at 215.6 EUR. The deviation from the price is +1.03% for the low point and -0.37% for the high point.Here is a more detailed summary of the historical variations registered by AENA:
Near a new HIGH record (5 years)
Type : Bullish
Timeframe : Weekly
Near a new HIGH record (1 year)
Type : Bullish
Timeframe : Weekly
Near a new HIGH record (1st january)
Type : Bullish
Timeframe : Weekly
Near a new LOW record (1 month)
Type : Bearish
Timeframe : Weekly
Technical
Technical analysis of this 1H chart of AENA indicates that the overall trend is slightly bullish. 60.71% of the signals given by moving averages are bullish. The slightly bullish signals given by short-term moving averages do not show a strengthening of this global trend. The Central Indicators market scanner is currently detecting several bullish signals that could impact this trend:
Bullish price crossover with Moving Average 20
Type : Bullish
Timeframe : 1 hour
Bullish price crossover with Moving Average 50
Type : Bullish
Timeframe : 1 hour
An assessment of technical indicators shows a moderate bullish signal.
No additional result has been identified by Central Indicators, the scanner specialised in technical indicators.
Central Patterns, the scanner specializing in chart patterns, did not identify any signals.
No result was found by the Central Candlesticks scanner on Japanese candlesticks.
| S3 | S2 | S1 | Price | R1 | R2 | R3 | |
|---|---|---|---|---|---|---|---|
| ProTrendLines | 207.6 | 210.6 | 214.8 | 214.8 | 216.6 | 218.2 | 220.2 |
| Change (%) | -3.35% | -1.96% | 0% | - | +0.84% | +1.58% | +2.51% |
| Change | -7.2 | -4.2 | 0 | - | +1.8 | +3.4 | +5.4 |
| Level | Minor | Major | Minor | - | Minor | Minor | Major |
Attention could also be paid to pivot points to set price objectives:
| Pivot points | S3 | S2 | S1 | PP | R1 | R2 | R3 |
|---|---|---|---|---|---|---|---|
| Standard | 207.1 | 209.5 | 212.5 | 214.9 | 217.9 | 220.3 | 223.3 |
| Camarilla | 213.9 | 214.4 | 214.9 | 215.4 | 215.9 | 216.4 | 216.9 |
| Woodie | 207.3 | 209.7 | 212.7 | 215.1 | 218.1 | 220.5 | 223.5 |
| Fibonacci | 209.5 | 211.6 | 212.9 | 214.9 | 217.0 | 218.3 | 220.3 |
| Pivot points | S3 | S2 | S1 | PP | R1 | R2 | R3 |
|---|---|---|---|---|---|---|---|
| Standard | 200.4 | 204.0 | 209.4 | 213.0 | 218.4 | 222.0 | 227.4 |
| Camarilla | 212.3 | 213.2 | 214.0 | 214.8 | 215.6 | 216.5 | 217.3 |
| Woodie | 201.3 | 204.5 | 210.3 | 213.5 | 219.3 | 222.5 | 228.3 |
| Fibonacci | 204.0 | 207.4 | 209.6 | 213.0 | 216.4 | 218.6 | 222.0 |
| Pivot points | S3 | S2 | S1 | PP | R1 | R2 | R3 |
|---|---|---|---|---|---|---|---|
| Standard | 188.6 | 196.4 | 205.6 | 213.4 | 222.6 | 230.4 | 239.6 |
| Camarilla | 210.1 | 211.7 | 213.2 | 214.8 | 216.4 | 217.9 | 219.5 |
| Woodie | 189.3 | 196.8 | 206.3 | 213.8 | 223.3 | 230.8 | 240.3 |
| Fibonacci | 196.4 | 202.9 | 206.9 | 213.4 | 219.9 | 223.9 | 230.4 |
Numerical data
The following are the details of the technical indicators and moving averages that were collected to generate this technical analysis:
| RSI (14): | 52.20 | |
| MACD (12,26,9): | 0.2000 | |
| Directional Movement: | -8.1 | |
| AROON (14): | 50.0 | |
| DEMA (21): | 214.8 | |
| Parabolic SAR (0,02-0,02-0,2): | 211.3 | |
| Elder Ray (13): | -0.8 | |
| Super Trend (3,10): | 213.2 | |
| Zig ZAG (10): | 214.8 | |
| VORTEX (21): | 0.9000 | |
| Stochastique (14,3,5): | 46.90 | |
| TEMA (21): | 215.0 | |
| Williams %R (14): | -48.10 | |
| Chande Momentum Oscillator (20): | 1.2 | |
| Repulse (5,40,3): | 0.4000 | |
| ROCnROLL: | 1 | |
| TRIX (15,9): | 0.0000 | |
| Courbe Coppock: | 1.00 |
| MA7: | 214.8 | |
| MA20: | 215.8 | |
| MA50: | 206.9 | |
| MA100: | 204.4 | |
| MAexp7: | 214.8 | |
| MAexp20: | 214.6 | |
| MAexp50: | 214.4 | |
| MAexp100: | 214.5 | |
| Price / MA7: | -0% | |
| Price / MA20: | -0.46% | |
| Price / MA50: | +3.82% | |
| Price / MA100: | +5.09% | |
| Price / MAexp7: | -0% | |
| Price / MAexp20: | +0.09% | |
| Price / MAexp50: | +0.19% | |
| Price / MAexp100: | +0.14% |
News
The last news published on AENA at the time of the generation of this analysis was as follows:
- Smiths Detection’s Largest Ever Order for HBS Systems Confirmed by Spanish Airport Operator, Aena
-
 Aena
Aena
About author
Online


Add a comment
Comments
0 comments on the analysis AENA - 1H