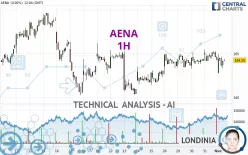
AENA - 1H - Technical analysis published on 02/01/2024 (GMT)
- 161
- 0
Click here for a new analysis!
- Timeframe : 1H
- - Analysis generated on
- Status : TARGET REACHED

Summary of the analysis

Additional analysis
Quotes
The AENA rating is 164.20 EUR. The price registered a decrease of -0.03% on the session with the lowest point at 162.75 EUR and the highest point at 164.95 EUR. The deviation from the price is +0.89% for the low point and -0.45% for the high point.The Central Gaps scanner detects the formation of a bearish gap marking the strong presence of sellers ahead of buyers at the opening. This formed a quotation gap.
Opening Gap DOWN
Type : Bearish
Timeframe : Openning
So that you have an overall view of the price change, here is a table showing the variations over several periods:
Near a new HIGH record (1 year)
Type : Bullish
Timeframe : Weekly
Near a new HIGH record (1st january)
Type : Bullish
Timeframe : Weekly
Near a new HIGH record (1 month)
Type : Bullish
Timeframe : Weekly
Technical
Technical analysis of this 1H chart of AENA indicates that the overall trend is bullish. The signals given by moving averages are 75.00% bullish. This bullish trend could slow down given the neutral signals currently being given by short-term moving averages. There is no crossing of moving average by the price or crossing of moving averages between themselves.
On the 18 technical indicators analysed, 5 are bullish, 8 are neutral and 5 are bearish. But beware of excesses. The Central Indicators scanner currently detects this:
CCI indicator is oversold : under -100
Type : Neutral
Timeframe : 1 hour
Ichimoku : price is over the cloud
Type : Bullish
Timeframe : 1 hour
Williams %R indicator is back over -50
Type : Bullish
Timeframe : 1 hour
An analysis of the price chart with the Central Patterns scanner (detector of chart patterns and resistances and supports) shows several results that can have an impact on the price change:
Near horizontal support
Type : Bullish
Timeframe : 1 hour
Support of channel is broken
Type : Bearish
Timeframe : 1 hour
The presence of a bearish pattern in Japanese candlesticks detected by Central Candlesticks that could cause a correction in the very short term was also detected:
Bearish doji star
Type : Bearish
Timeframe : 1 hour
| S3 | S2 | S1 | Price | R1 | R2 | R3 | |
|---|---|---|---|---|---|---|---|
| ProTrendLines | 162.05 | 163.26 | 164.09 | 164.20 | 165.43 | 166.64 | 168.85 |
| Change (%) | -1.31% | -0.57% | -0.07% | - | +0.75% | +1.49% | +2.83% |
| Change | -2.15 | -0.94 | -0.11 | - | +1.23 | +2.44 | +4.65 |
| Level | Minor | Intermediate | Major | - | Major | Minor | Major |
To determine price objectives, it is also possible to use the pivot points. Here is the price position in relation to pivot points:
| Pivot points | S3 | S2 | S1 | PP | R1 | R2 | R3 |
|---|---|---|---|---|---|---|---|
| Standard | 162.48 | 163.32 | 163.78 | 164.62 | 165.08 | 165.92 | 166.38 |
| Camarilla | 163.89 | 164.01 | 164.13 | 164.25 | 164.37 | 164.49 | 164.61 |
| Woodie | 162.30 | 163.23 | 163.60 | 164.53 | 164.90 | 165.83 | 166.20 |
| Fibonacci | 163.32 | 163.81 | 164.12 | 164.62 | 165.11 | 165.42 | 165.92 |
| Pivot points | S3 | S2 | S1 | PP | R1 | R2 | R3 |
|---|---|---|---|---|---|---|---|
| Standard | 155.78 | 158.07 | 160.83 | 163.12 | 165.88 | 168.17 | 170.93 |
| Camarilla | 162.21 | 162.67 | 163.14 | 163.60 | 164.06 | 164.53 | 164.99 |
| Woodie | 156.03 | 158.19 | 161.08 | 163.24 | 166.13 | 168.29 | 171.18 |
| Fibonacci | 158.07 | 160.00 | 161.19 | 163.12 | 165.05 | 166.24 | 168.17 |
| Pivot points | S3 | S2 | S1 | PP | R1 | R2 | R3 |
|---|---|---|---|---|---|---|---|
| Standard | 148.55 | 153.85 | 159.05 | 164.35 | 169.55 | 174.85 | 180.05 |
| Camarilla | 161.36 | 162.33 | 163.29 | 164.25 | 165.21 | 166.18 | 167.14 |
| Woodie | 148.50 | 153.83 | 159.00 | 164.33 | 169.50 | 174.83 | 180.00 |
| Fibonacci | 153.85 | 157.86 | 160.34 | 164.35 | 168.36 | 170.84 | 174.85 |
Numerical data
The following are the details of the technical indicators and moving averages that were collected to generate this technical analysis:
| RSI (14): | 49.14 | |
| MACD (12,26,9): | 0.0600 | |
| Directional Movement: | -14.70 | |
| AROON (14): | -64.29 | |
| DEMA (21): | 164.48 | |
| Parabolic SAR (0,02-0,02-0,2): | 165.24 | |
| Elder Ray (13): | -0.13 | |
| Super Trend (3,10): | 163.49 | |
| Zig ZAG (10): | 164.20 | |
| VORTEX (21): | 0.9700 | |
| Stochastique (14,3,5): | 46.91 | |
| TEMA (21): | 164.30 | |
| Williams %R (14): | -46.30 | |
| Chande Momentum Oscillator (20): | 0.05 | |
| Repulse (5,40,3): | 0.1600 | |
| ROCnROLL: | -1 | |
| TRIX (15,9): | 0.0200 | |
| Courbe Coppock: | 0.04 |
| MA7: | 163.56 | |
| MA20: | 164.17 | |
| MA50: | 162.34 | |
| MA100: | 152.09 | |
| MAexp7: | 164.26 | |
| MAexp20: | 164.33 | |
| MAexp50: | 164.05 | |
| MAexp100: | 163.93 | |
| Price / MA7: | +0.39% | |
| Price / MA20: | +0.02% | |
| Price / MA50: | +1.15% | |
| Price / MA100: | +7.96% | |
| Price / MAexp7: | -0.04% | |
| Price / MAexp20: | -0.08% | |
| Price / MAexp50: | +0.09% | |
| Price / MAexp100: | +0.16% |
News
The last news published on AENA at the time of the generation of this analysis was as follows:
- Smiths Detection’s Largest Ever Order for HBS Systems Confirmed by Spanish Airport Operator, Aena
-
 Aena
Aena
About author
Online


Add a comment
Comments
0 comments on the analysis AENA - 1H