Technical analyses - GROUPON INC. - English
You are currently viewing all technical analyses of the financial instrument GROUPON INC. regarding all markets in English regarding all markets, sorted by Latest comments.
Sort : Latest comments | Latest posted
GROUPON INC.
> Analyses

 Thank you
Reply
Chart
Thank you
Reply
Chart
Londinia
has published a new analysis for Vincent Launay.
- 0
- 97483
- 15950
- 0
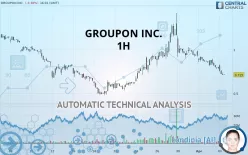
Timeframe : 1H - Simple chart
Status : INVALID
All elements being clearly bearish, it would be possible for traders to trade only short positions (for sale) on GROUPON INC. as long as the price remains well below 0.760 USD. The sellers” bearish…
GROUPON INC.
> Analyses
 Thank you
Reply
Chart
Thank you
Reply
Chart
Londinia
has published a new analysis for Vincent Launay.
- 0
- 97483
- 15950
- 0
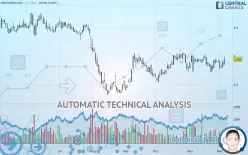
Timeframe : Daily - Simple chart
Status : TARGET REACHED
GROUPON INC. is part of a very strong bullish trend. Traders may consider trading only long positions (at the time of purchase) as long as the price remains well above 2.72 USD. The next resistance…
GROUPON INC.
> Analyses
 Thank you
Reply
Chart
Thank you
Reply
Chart
Londinia
has published a new analysis for Vincent Launay.
- 0
- 97483
- 15950
- 0
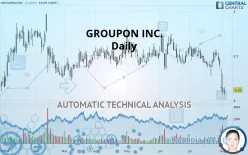
Timeframe : Daily - Simple chart
Status : TARGET REACHED
The bearish trend is currently very strong for GROUPON INC.. As long as the price remains below the resistance at 3.29 USD, you could try to take advantage of the bearish rally. The first bearish…
GROUPON INC.
> Analyses
 Thank you
Reply
Chart
Thank you
Reply
Chart
Londinia
has published a new analysis for Vincent Launay.
- 0
- 97483
- 15950
- 0
Timeframe : Daily - Simple chart
Status : TARGET REACHED
There is a bearish trend on GROUPON INC. both at the basic level and in the short term. A sale could be considered, so long as the price remains below 3.65 USD. Each support break is a strong signal…
GROUPON INC.
> Analyses

 Thank you
Reply
Chart
Thank you
Reply
Chart
tasciccac has published a new analysis.
- 22
- 92
- 270
- 94
Timeframe : Weekly - Simple chart
$GRPN test its bearish trend line, and close just above it. And the long upper shadow test its Ichimoku cloud.

