
- Status :
- Language : English
- Registered on :
- Analyses : 118
- Overall rating : 86
- Comments : 5
- Followers : 5
- Followed : 0
Technical analyses from tariyia - Page 2
Sort : Latest comments | Latest posted
FORTINET INC.
> Analyses

 Thank you
Reply
Chart
Thank you
Reply
Chart
tariyia has published a new analysis.
- 5
- 118
- 86
- 5
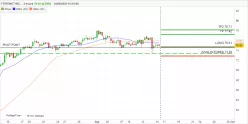
Timeframe : 2H - Chart + Price target(s)
FORTINET INC. @ (Timeframe 4 hour) conditions:
Moving Average bullish crossovers : AMA20 & AMA50 (4H):
Price is back over the pivot point (Daily):
Momentum (10) Bullish (Daily):
Hull Moving…
FTX TOKEN - FTT/USD
> Analyses
 Thank you
Reply
Chart
Thank you
Reply
Chart
tariyia has published a new analysis.
- 5
- 118
- 86
- 5
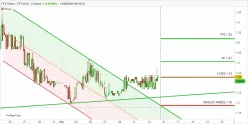
Timeframe : 2H - Chart + Price target(s)
FTT/USD @ (Timeframe 2 hour) conditions:
Slightly Bullish at Short-term (2H)
Resistance of channel is broken (Daily)
Williams Fractal Trailing Stops Bullish (2H)
JUST - JST/USD
> Analyses
 Thank you
Reply
Chart
Thank you
Reply
Chart
tariyia has published a new analysis.
- 5
- 118
- 86
- 5
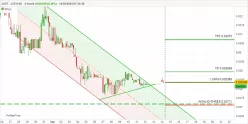
Timeframe : 4H - Chart + Price target(s)
JST/USD @ (Timeframe 4 hour) conditions:
Bullish trend reversal : AMA 20 (4H)
Near support of triangle (Daily)
Williams Fractal Trailing Stops Bullish (2H)
JD.COM INC. ADS
> Analyses
 Thank you
Reply
Chart
Thank you
Reply
Chart
tariyia has published a new analysis.
- 5
- 118
- 86
- 5
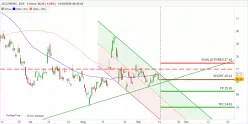
Timeframe : 4H - Chart + Price target(s)
JD.COM INC. ADS @ (Timeframe 4 Hour) conditions:
Bearish trend reversal : Moving Average 100 (4H)
Bearish trend reversal : AMA 50 (4H)
Near horizontal resistance (Daily)
Momentum (10) Bearish…
AIRBNB INC.
> Analyses
 Thank you
Reply
Chart
Thank you
Reply
Chart
tariyia has published a new analysis.
- 5
- 118
- 86
- 5
Timeframe : 4H - Chart + Price target(s)
AIRBNB INC. @ (Timeframe 4 Hour) conditions:
Ichimoku - Bearish crossover : Tenkan & Kijun (Daily)
Near resistance of channel (Daily)
Near resistance of channel (1H)
Williams Fractal…
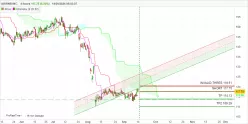
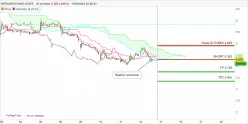
MEDIANTECHNOLOGIES
> Analyses
 Thank you
Reply
Chart
Thank you
Reply
Chart
tariyia has published a new analysis.
- 5
- 118
- 86
- 5
Timeframe : 30 min. - Chart + Price target(s)
MEDIANTECHNOLOGIES @ (Timeframe 30 Minutes) conditions:
Ichimoku - Bearish crossover : Tenkan & Kijun (30 min)
Price is back under the pivot point (4H)
Support of channel is broken…
COSMOS - ATOM/USDT
> Analyses
 Thank you
Reply
Chart
Thank you
Reply
Chart
tariyia has published a new analysis.
- 5
- 118
- 86
- 5
Timeframe : 30 min. - Chart + Trading signal
ATOM/USDT @ (Timeframe 15 Minutes) conditions:
MACD crosses DOWN its Moving Average (15 min)
Bearish price crossover with AMA(100) (1H)
Price is back under the pivot point (Daily)
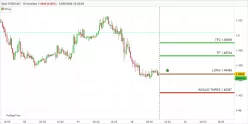
EUR/CAD
> Analyses
 Thank you
Reply
Chart
Thank you
Reply
Chart
tariyia has published a new analysis.
- 5
- 118
- 86
- 5
Timeframe : 30 min. - Chart + Price target(s)
EUR/CAD @ (Timeframe 30 Minutes) conditions:
RSI indicator: bullish divergence (2H)
RSI indicator: bullish divergence (4H)
Momentum (10) Bullish (Daily)
Hull Moving Average (9) Bullish (Daily)
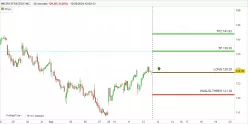
MICROSTRATEGY INC.
> Analyses
 Thank you
Reply
Chart
Thank you
Reply
Chart
tariyia has published a new analysis.
- 5
- 118
- 86
- 5
Timeframe : 30 min. - Chart + Price target(s)
MICROSTRATEGY INC. @ (Timeframe 30 Minutes) conditions:
Momentum indicator is back over 0 (30 min)
Price is back over the pivot point (4H)
Price is back over the pivot point (Daily)
Momentum (10)…

