FTX TOKEN - FTT/USD overview
FTX TOKEN - FTT/USD
> Analyses

 Thank you
Reply
Chart
Thank you
Reply
Chart
Londinia
has published a new analysis.
- 0
- 93953
- 15804
- 0
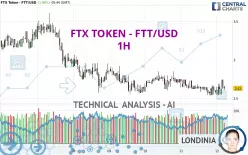
Timeframe : 1H - Simple chart
Status : LEVEL MAINTAINED
The short-term increase currently reinforces the basic trend, which is only slightly bullish. It would be possible for traders to only trade long positions (at the time of purchase) on FTX TOKEN -…
FTX TOKEN - FTT/USD
> Analyses
 Thank you
Reply
Chart
Thank you
Reply
Chart
Londinia
has published a new analysis.
- 0
- 93953
- 15804
- 0
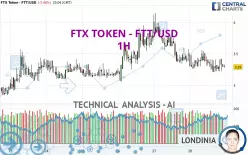
Timeframe : 1H - Simple chart
Status : NEUTRAL
The neutral short-term trend shows a weakening of the basic, slightly bullish trend on FTX TOKEN - FTT/USD. It is difficult to advise a trading direction under these conditions. The first resistance…
FTX TOKEN - FTT/USD
> Analyses
 Thank you
Reply
Chart
Thank you
Reply
Chart
Londinia
has published a new analysis.
- 0
- 93953
- 15804
- 0
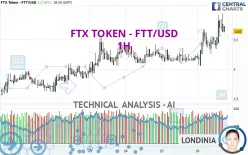
Timeframe : 1H - Simple chart
Status : LEVEL MAINTAINED
FTX TOKEN - FTT/USD is part of a very strong bearish trend. Traders may consider trading only short positions (for sale) as long as the price remains well below 1.93 USD. The next support located at…
FTX TOKEN - FTT/USD
> Analyses
 Thank you
Reply
Chart
Thank you
Reply
Chart
Londinia
has published a new analysis.
- 0
- 93953
- 15804
- 0
Timeframe : 1H - Simple chart
Status : NEUTRAL
A slightly bullish trend and a neutral short term. With such a pattern, it is difficult to favour buying or selling. The first resistance is located at 2.03 USD. The first support is located at 1.97…
FTX TOKEN - FTT/USD
> Analyses
 Thank you
Reply
Chart
Thank you
Reply
Chart
Londinia
has published a new analysis.
- 0
- 93953
- 15804
- 0
Timeframe : 1H - Simple chart
Status : TARGET REACHED
Has the basic bearish trend slowed or is it lacking in power? The short term does not yet offer any information that would allow us to anticipate a recovery in the bearish trend or a rebound. Sellers'…
FTX TOKEN - FTT/USD
> Analyses
 Thank you
Reply
Chart
Thank you
Reply
Chart
Londinia
has published a new analysis.
- 0
- 93953
- 15804
- 0
Timeframe : 1H - Simple chart
Status : INVALID
There is a bearish trend on FTX TOKEN - FTT/USD both at the basic level and in the short term. A sale could be considered, so long as the price remains below 3.46 USD. Each support break is a strong…
FTX TOKEN - FTT/USD
> Analyses
 Thank you
Reply
Chart
Thank you
Reply
Chart
Londinia
has published a new analysis.
- 0
- 93953
- 15804
- 0
Timeframe : 1H - Simple chart
Status : TARGET REACHED
FTX TOKEN - FTT/USD is part of a very strong bullish trend. Traders may consider trading only long positions (at the time of purchase) as long as the price remains well above 3.57 USD. The next…
FTX TOKEN - FTT/USD
> Analyses
 Thank you
Reply
Chart
Thank you
Reply
Chart
Londinia
has published a new analysis.
- 0
- 93953
- 15804
- 0
Timeframe : 1H - Simple chart
Status : INVALID
The bullish trend is truly tentative and does not seem to be supported in the short term. It is advisable to trade FTX TOKEN - FTT/USD with the greatest caution, while favouring long positions (at the…

