Analyses of Traders and financial instruments followed by shorr - Page 4
Sort : Latest comments | Latest posted
NORFOLK SOUTHERN
> Analyses

 Thank you
Reply
Chart
Thank you
Reply
Chart
emerick has published a new analysis.
- 3
- 33
- 175
- 1
Timeframe : Daily - Simple chart
#weekly #bearish
all indicators are divergent
#daily #bearish
all indicator are negative
MCDONALD S CORP.
> Analyses
 Thank you
Reply
Chart
Thank you
Reply
Chart
emerick has published a new analysis.
- 3
- 33
- 175
- 1
Timeframe : Daily - Chart + Trading signal
#daily : #bearish reversal
All indicators #divergent
EP=212
SL=215
BE=205
TP=200
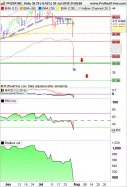
PFIZER INC.
> Analyses
 Thank you
Reply
Chart
Thank you
Reply
Chart
emerick has published a new analysis.
- 3
- 33
- 175
- 1
Timeframe : Daily - Chart + Trading signal
#weekly: #bearish
All indicators are negative
#daily:bearish
full #gap down
EP=38.90
SL=40.89
BE=37.30
TP=34
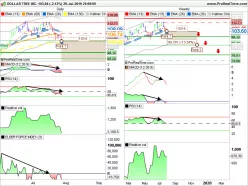
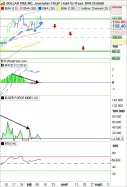
DOLLAR TREE INC.
> Analyses
 Thank you
Reply
Chart
Thank you
Reply
Chart
emerick has published a new analysis.
- 3
- 33
- 175
- 1
Timeframe : Daily - Chart + Price target(s)
#weekly:double top in progress
Divergence of all indicator
#daily : double top confirmed - Daily neckline broken
EP=114
SL=117
BE=98
TP=89
CISCO SYSTEMS INC.
> Analyses
 Thank you
Reply
Chart
Thank you
Reply
Chart
emerick has published a new analysis.
- 3
- 33
- 175
- 1
Timeframe : Daily - Chart + Trading signal
#weekly: bearish
bearish patterns: multiple tops
all indicators divergent
#daily: waiting for a pullback
EP=57.0
SL=58.3
BE=54.6
TP=53.1
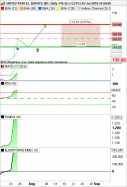
UNITED PARCEL SERVICE INC.
> Analyses
 Thank you
Reply
Chart
Thank you
Reply
Chart
emerick has published a new analysis.
- 3
- 33
- 175
- 1
Timeframe : Daily - Chart + Trading signal
Waiting for pullback
KANSAS CITY SOUTHERN > Analyses
 Thank you
Reply
Thank you
Reply
emerick has published a new analysis.
- 3
- 33
- 175
- 1
Timeframe : Daily - Chart + Trading signal
#weekly:uptrend
all indicators divergent
#daily: triangle ascending invalided
catching reversal
EP=117.5
SL=119.5
BE=113.5
TP=99.2
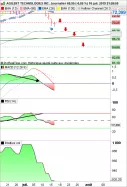
AGILENT TECHNOLOGIES INC.
> Analyses
 Thank you
Reply
Chart
Thank you
Reply
Chart
emerick has published a new analysis.
- 3
- 33
- 175
- 1
Timeframe : Daily - Chart + Trading signal
# weekly uptrend
Volume tends to sink sush as the other indicators (macd, rsi)
# daily : catching downtrend
Neckline is the upcoming target
EP=70.30
SL=71.5
BE=68.30
TP=66.7
WELLTOWER INC.
> Analyses
 Thank you
Reply
Chart
Thank you
Reply
Chart
emerick has published a new analysis.
- 3
- 33
- 175
- 1
Timeframe : Daily - Chart + Trading signal
weekly : uptrend
daily: downtrend -> catching uptrend
EP=84
SL=82
BE=87
TP=88
DOLLAR TREE INC.
> Analyses
 Thank you
Reply
Chart
Thank you
Reply
Chart
emerick has published a new analysis.
- 3
- 33
- 175
- 1
Timeframe : Daily - Chart + Trading signal
#weekly: multiple top patterns in progress
#daily: catching reversal

