Analyses of Traders and financial instruments followed by shorr - Page 3
Sort : Latest comments | Latest posted
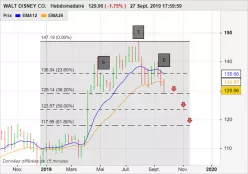
WALT DISNEY CO.
> Analyses

 Thank you
Reply
Chart
Thank you
Reply
Chart
emerick has published a new analysis.
- 3
- 33
- 175
- 1
Timeframe : Weekly - Simple chart
Shoulder Head Shoulder this weekly pattern is in progress.
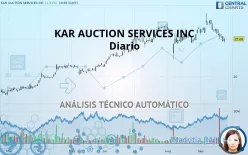
OPENLANE INC.
> Analyses

 Thank you
Reply
Chart
Thank you
Reply
Chart
Madritia
has published a new analysis for Vincent Launay.
- 0
- 62555
- 9446
- 0
Timeframe : Daily - Simple chart
Status : NEUTRAL
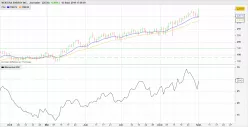
WALMART INC.
> Analyses
 Thank you
Reply
Chart
Thank you
Reply
Chart
emerick has published a new analysis.
- 3
- 33
- 175
- 1
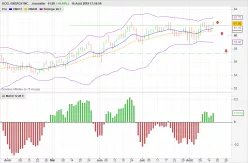
Timeframe : Weekly - Simple chart
According to the indicators weekly bearish reversal in sight.
In addition Volume declines.
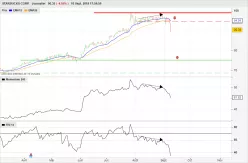
STARBUCKS CORP.
> Analyses
 Thank you
Reply
Chart
Thank you
Reply
Chart
emerick has published a new analysis.
- 3
- 33
- 175
- 1
Timeframe : Daily - Chart + Price target(s)
due to a bearish divergence.
MASTERCARD INC.
> Analyses
 Thank you
Reply
Chart
Thank you
Reply
Chart
emerick has published a new analysis.
- 3
- 33
- 175
- 1
Timeframe : Daily - Chart + Price target(s)
MA still climbs up, as long as it remains above 268
PROCTER & GAMBLE CO.
> Analyses
 Thank you
Reply
Chart
Thank you
Reply
Chart
emerick has published a new analysis.
- 3
- 33
- 175
- 1
Timeframe : Daily - Chart + Price target(s)
it will climb up if it remains above 116
NEXTERA ENERGY INC.
> Analyses
 Thank you
Reply
Chart
Thank you
Reply
Chart
emerick has published a new analysis.
- 3
- 33
- 175
- 1
Timeframe : Daily - Chart + Price target(s)
momentum increase
XCEL ENERGY INC.
> Analyses
 Thank you
Reply
Chart
Thank you
Reply
Chart
emerick has published a new analysis.
- 3
- 33
- 175
- 1
Timeframe : Daily - Chart + Price target(s)
#xcel daily #bearish divergence
ISHARES IBOXX HIGH YIELD
> Analyses
 Thank you
Reply
Chart
Thank you
Reply
Chart
emerick has published a new analysis.
- 3
- 33
- 175
- 1
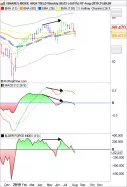
Timeframe : Weekly - Simple chart
#weekly : bearish divergence in progress
S&P500 INDEX
> Analyses
 Thank you
Reply
Chart
Thank you
Reply
Chart
emerick has published a new analysis.
- 3
- 33
- 175
- 1
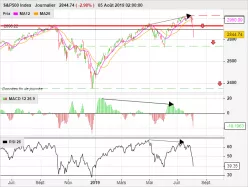
Timeframe : Daily - Chart + Price target(s)
#weekly #bearish #divergence and #daily #bearish #divergence

