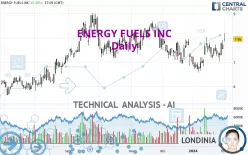
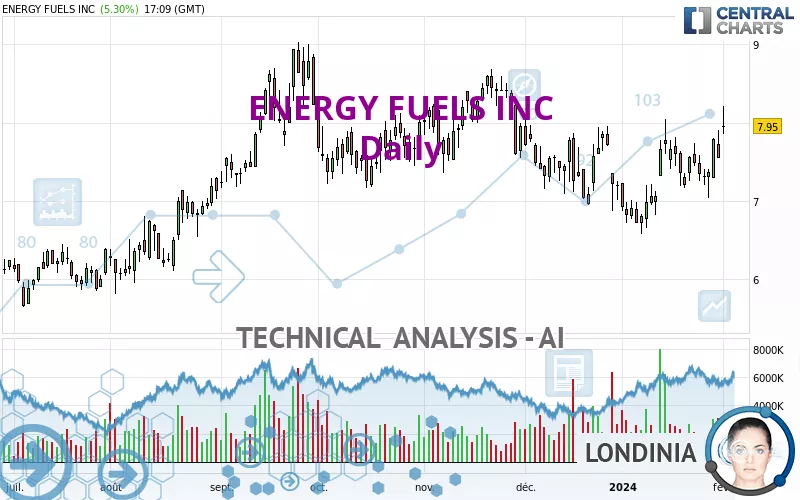
ENERGY FUELS INC - Daily - Technical analysis published on 02/01/2024 (GMT)
- 169
- 0
Click here for a new analysis!
- Timeframe : Daily
- - Analysis generated on
- Status : INVALID
Summary of the analysis

Additional analysis
Quotes
The ENERGY FUELS INC rating is 7.95 USD. On the day, this instrument gained +5.30% and was between 7.85 USD and 8.21 USD. This implies that the price is at +1.27% from its lowest and at -3.17% from its highest.The Central Gaps scanner detects a bullish gap which is a sign that buyers have taken the lead in the very short term.
Opening Gap UP
Type : Bullish
Timeframe : Openning
Here is a more detailed summary of the historical variations registered by ENERGY FUELS INC:
New HIGH record (1st january)
Type : Bullish
Timeframe : Weekly
New HIGH record (1 month)
Type : Bullish
Timeframe : Weekly
Technical
Technical analysis of ENERGY FUELS INC in Daily shows an overall bullish trend. 71.43% of the signals given by moving averages are bullish. This bullish trend is supported by the strong bullish signals given by short-term moving averages. An assessment of moving averages reveals a bullish signal that could impact this trend:
Bullish price crossover with Moving Average 100
Type : Bullish
Timeframe : Daily
An assessment of technical indicators shows a strong bullish signal.
But beware of excesses. The Central Indicators scanner currently detects this:
CCI indicator is overbought : over 100
Type : Neutral
Timeframe : Daily
Williams %R indicator is overbought : over -20
Type : Neutral
Timeframe : Daily
Pivot points : price is over resistance 1
Type : Neutral
Timeframe : Daily
Pivot points : price is over resistance 1
Type : Neutral
Timeframe : Weekly
Parabolic SAR indicator bullish reversal
Type : Bullish
Timeframe : Daily
Ichimoku : price is over the cloud
Type : Bullish
Timeframe : Daily
Momentum indicator is back over 0
Type : Bullish
Timeframe : Daily
The Central Patterns scanner, which studies chart patterns, resistances and supports, has identified these signals:
Horizontal resistance is broken
Type : Bullish
Timeframe : Daily
Resistance of channel is broken
Type : Bullish
Timeframe : Daily
The Central Candlesticks scanner currently notes the presence of this pattern in Japanese candlesticks that could mark the end of the short-term trend currently underway:
Doji
Type : Neutral
Timeframe : Daily
| S3 | S2 | S1 | Price | R1 | R2 | R3 | |
|---|---|---|---|---|---|---|---|
| ProTrendLines | 6.70 | 7.24 | 7.73 | 7.95 | 8.12 | 8.60 | 8.94 |
| Change (%) | -15.72% | -8.93% | -2.77% | - | +2.14% | +8.18% | +12.45% |
| Change | -1.25 | -0.71 | -0.22 | - | +0.17 | +0.65 | +0.99 |
| Level | Major | Intermediate | Major | - | Major | Intermediate | Major |
To determine price objectives, it is also possible to use the pivot points. Here is the price position in relation to pivot points:
| Pivot points | S3 | S2 | S1 | PP | R1 | R2 | R3 |
|---|---|---|---|---|---|---|---|
| Standard | 7.05 | 7.30 | 7.42 | 7.67 | 7.79 | 8.04 | 8.16 |
| Camarilla | 7.45 | 7.48 | 7.52 | 7.55 | 7.58 | 7.62 | 7.65 |
| Woodie | 7.00 | 7.27 | 7.37 | 7.64 | 7.74 | 8.01 | 8.11 |
| Fibonacci | 7.30 | 7.44 | 7.53 | 7.67 | 7.81 | 7.90 | 8.04 |
| Pivot points | S3 | S2 | S1 | PP | R1 | R2 | R3 |
|---|---|---|---|---|---|---|---|
| Standard | 6.48 | 6.82 | 7.06 | 7.40 | 7.64 | 7.98 | 8.22 |
| Camarilla | 7.14 | 7.19 | 7.25 | 7.30 | 7.35 | 7.41 | 7.46 |
| Woodie | 6.43 | 6.80 | 7.01 | 7.38 | 7.59 | 7.96 | 8.17 |
| Fibonacci | 6.82 | 7.04 | 7.18 | 7.40 | 7.62 | 7.76 | 7.98 |
| Pivot points | S3 | S2 | S1 | PP | R1 | R2 | R3 |
|---|---|---|---|---|---|---|---|
| Standard | 5.28 | 5.93 | 6.74 | 7.39 | 8.20 | 8.85 | 9.66 |
| Camarilla | 7.15 | 7.28 | 7.42 | 7.55 | 7.68 | 7.82 | 7.95 |
| Woodie | 5.36 | 5.97 | 6.82 | 7.43 | 8.28 | 8.89 | 9.74 |
| Fibonacci | 5.93 | 6.49 | 6.83 | 7.39 | 7.95 | 8.29 | 8.85 |
Numerical data
The following is the status of the technical indicators and moving averages at the time of publication of this technical analysis:
| RSI (14): | 58.93 | |
| MACD (12,26,9): | 0.0700 | |
| Directional Movement: | 12.39 | |
| AROON (14): | 100.00 | |
| DEMA (21): | 7.51 | |
| Parabolic SAR (0,02-0,02-0,2): | 7.03 | |
| Elder Ray (13): | 0.52 | |
| Super Trend (3,10): | 6.84 | |
| Zig ZAG (10): | 7.89 | |
| VORTEX (21): | 1.0500 | |
| Stochastique (14,3,5): | 71.17 | |
| TEMA (21): | 7.65 | |
| Williams %R (14): | -26.27 | |
| Chande Momentum Oscillator (20): | 0.18 | |
| Repulse (5,40,3): | -1.7600 | |
| ROCnROLL: | 1 | |
| TRIX (15,9): | 0.0100 | |
| Courbe Coppock: | 12.69 |
| MA7: | 7.53 | |
| MA20: | 7.35 | |
| MA50: | 7.52 | |
| MA100: | 7.71 | |
| MAexp7: | 7.60 | |
| MAexp20: | 7.46 | |
| MAexp50: | 7.48 | |
| MAexp100: | 7.42 | |
| Price / MA7: | +5.58% | |
| Price / MA20: | +8.16% | |
| Price / MA50: | +5.72% | |
| Price / MA100: | +3.11% | |
| Price / MAexp7: | +4.61% | |
| Price / MAexp20: | +6.57% | |
| Price / MAexp50: | +6.28% | |
| Price / MAexp100: | +7.14% |
News
The latest news and videos published on ENERGY FUELS INC at the time of the analysis were as follows:
- Energy Fuels Inc. (NYSE American: UUUU) (TSX: EFR) Breaking Cycle of Dependence
- Energy Fuels Inc. (NYSE American: UUUU) (TSX: EFR) Tilting Balance Back to America
- Energy Fuels Inc. CEO Discusses Newly Released Sustainability Report and Entry Into Rare Earths Production for 2021
- Energy Fuels Inc. (NYSE American: UUUU) (TSX: EFR) Marks Milestone, Produces Mixed REE Concentrate at Utah Mill
- Energy Fuels Inc. (NYSE American: UUUU) (TSX: EFR) Working to Re-Ignite REE production in the US
About author
Online


Add a comment
Comments
0 comments on the analysis ENERGY FUELS INC - Daily