LINDE PLC - Daily - Technical analysis published on 09/23/2019 (GMT)
- 334
- 0
- Who voted?
Click here for a new analysis!
- Timeframe : Daily
- - Analysis generated on
- Status : INVALID
Summary of the analysis

Additional analysis
Quotes
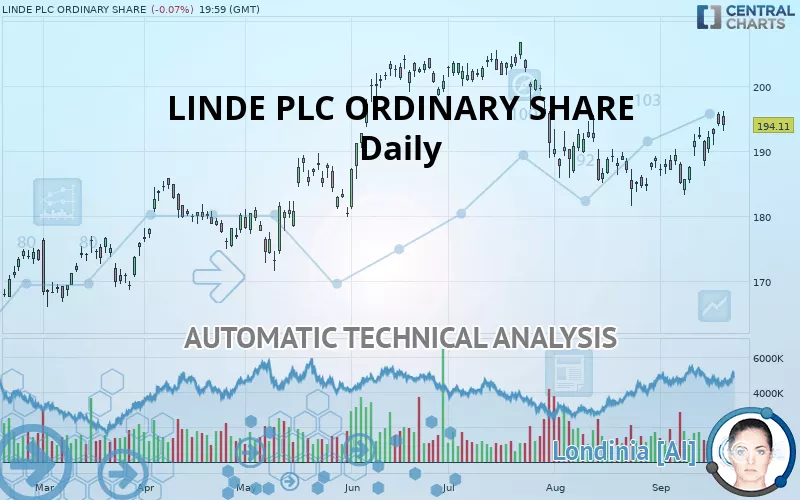
The LINDE PLC ORDINARY SHARE rating is 194.11 USD. On the day, this instrument lost -0.07% and was traded between 193.10 USD and 196.25 USD over the period. The price is currently at +0.52% from its lowest and -1.09% from its highest.A study of price movements over other periods shows the following variations:
Technical
Technical analysis of LINDE PLC ORDINARY SHARE in Daily shows an overall bullish trend. 71.43% of the signals given by moving averages are bullish. This bullish trend is supported by the strong bullish signals given by short-term moving averages. The Central Indicators scanner detects bullish signals on moving averages that could impact this trend:
Bullish price crossover with Moving Average 50
Type : Bullish
Timeframe : Daily
Bullish price crossover with adaptative moving average 100
Type : Bullish
Timeframe : Daily
An assessment of technical indicators shows a strong bullish signal.
But beware of excesses. The Central Indicators scanner currently detects this:
CCI indicator is overbought : over 100
Type : Neutral
Timeframe : Daily
Williams %R indicator is overbought : over -20
Type : Neutral
Timeframe : Daily
Ichimoku : price is over the cloud
Type : Bullish
Timeframe : Daily
SuperTrend indicator bullish reversal
Type : Bullish
Timeframe : Daily
MACD indicator is back over 0
Type : Bullish
Timeframe : Daily
Ichimoku - Bullish crossover : Tenkan & Kijun
Type : Bullish
Timeframe : Daily
Price is back over the pivot point
Type : Bullish
Timeframe : Weekly
Price is back under the pivot point
Type : Bearish
Timeframe : Daily
The Central Patterns scanner, which studies chart patterns, resistances and supports, has identified this signal:
Resistance of channel is broken
Type : Bullish
Timeframe : Daily
The Central Candlesticks scanner, specialised in Japanese candlesticks, did not identify any signals.
| S3 | S2 | S1 | Price | R1 | R2 | |
|---|---|---|---|---|---|---|
| ProTrendLines | 161.85 | 173.35 | 185.03 | 194.11 | 199.53 | 206.51 |
| Change (%) | -16.62% | -10.69% | -4.68% | - | +2.79% | +6.39% |
| Change | -32.26 | -20.76 | -9.08 | - | +5.42 | +12.40 |
| Level | Minor | Major | Major | - | Minor | Major |
Attention could also be paid to pivot points to set price objectives:
| Pivot points | S3 | S2 | S1 | PP | R1 | R2 | R3 |
|---|---|---|---|---|---|---|---|
| Standard | 191.20 | 192.56 | 193.40 | 194.76 | 195.60 | 196.96 | 197.80 |
| Camarilla | 193.64 | 193.84 | 194.04 | 194.24 | 194.44 | 194.64 | 194.85 |
| Woodie | 190.94 | 192.43 | 193.14 | 194.63 | 195.34 | 196.83 | 197.54 |
| Fibonacci | 192.56 | 193.40 | 193.92 | 194.76 | 195.60 | 196.12 | 196.96 |
| Pivot points | S3 | S2 | S1 | PP | R1 | R2 | R3 |
|---|---|---|---|---|---|---|---|
| Standard | 175.26 | 179.26 | 185.71 | 189.71 | 196.16 | 200.16 | 206.61 |
| Camarilla | 189.29 | 190.24 | 191.20 | 192.16 | 193.12 | 194.08 | 195.03 |
| Woodie | 176.49 | 179.87 | 186.94 | 190.32 | 197.39 | 200.77 | 207.84 |
| Fibonacci | 179.26 | 183.25 | 185.72 | 189.71 | 193.70 | 196.17 | 200.16 |
| Pivot points | S3 | S2 | S1 | PP | R1 | R2 | R3 |
|---|---|---|---|---|---|---|---|
| Standard | 167.79 | 174.70 | 181.80 | 188.71 | 195.81 | 202.72 | 209.82 |
| Camarilla | 185.06 | 186.34 | 187.63 | 188.91 | 190.19 | 191.48 | 192.76 |
| Woodie | 167.90 | 174.75 | 181.91 | 188.76 | 195.92 | 202.77 | 209.93 |
| Fibonacci | 174.70 | 180.05 | 183.36 | 188.71 | 194.06 | 197.37 | 202.72 |
Numerical data
The following is the status of technical indicators and moving averages registered at the time this technical analysis was created:
| RSI (14): | 58.35 | |
| MACD (12,26,9): | 0.6200 | |
| Directional Movement: | 3.05 | |
| AROON (14): | 57.14 | |
| DEMA (21): | 190.40 | |
| Parabolic SAR (0,02-0,02-0,2): | 187.45 | |
| Elder Ray (13): | 3.91 | |
| Super Trend (3,10): | 185.13 | |
| Zig ZAG (10): | 194.11 | |
| VORTEX (21): | 0.9200 | |
| Stochastique (14,3,5): | 86.29 | |
| TEMA (21): | 192.47 | |
| Williams %R (14): | -16.47 | |
| Chande Momentum Oscillator (20): | 6.55 | |
| Repulse (5,40,3): | -1.5400 | |
| ROCnROLL: | 1 | |
| TRIX (15,9): | -0.0500 | |
| Courbe Coppock: | 5.53 |
| MA7: | 192.21 | |
| MA20: | 188.55 | |
| MA50: | 192.47 | |
| MA100: | 192.47 | |
| MAexp7: | 192.11 | |
| MAexp20: | 190.26 | |
| MAexp50: | 191.06 | |
| MAexp100: | 187.77 | |
| Price / MA7: | +0.99% | |
| Price / MA20: | +2.95% | |
| Price / MA50: | +0.85% | |
| Price / MA100: | +0.85% | |
| Price / MAexp7: | +1.04% | |
| Price / MAexp20: | +2.02% | |
| Price / MAexp50: | +1.60% | |
| Price / MAexp100: | +3.38% |
About author

Online


Add a comment
Comments
0 comments on the analysis LINDE PLC - Daily