| Open: | 16.38 |
| Change: | -0.36 |
| Volume: | 68,487 |
| Low: | 15.88 |
| High: | 16.38 |
| High / Low range: | 0.50 |
| Type: | Stocks |
| Ticker: | CVGW |
| ISIN: |
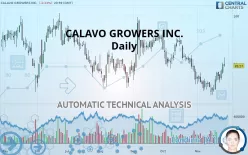
CALAVO GROWERS INC. - Daily - Technical analysis published on 11/27/2019 (GMT)
- 312
- 0
- 11/27/2019 - 21:43
- Who voted?
- Timeframe : Daily
- - Analysis generated on 11/27/2019 - 21:41
- Status : NEUTRAL

Summary of the analysis

Additional analysis
Quotes
CALAVO GROWERS INC. rating 89.57 USD. The price is lower by -0.23% since the last closing and was between 89.37 USD and 91.30 USD. This implies that the price is at +0.22% from its lowest and at -1.89% from its highest.The Central Gaps scanner detects a bullish opening. A small advantage for buyers in the very short term.
Bullish opening
Type : Bullish
Timeframe : Openning
So that you have an overall view of the price change, here is a table showing the variations over several periods:
Near a new HIGH record (1 month)
Type : Bullish
Timeframe : Weekly
Technical
Technical analysis of CALAVO GROWERS INC. in Daily shows an overall slightly bearish trend. 60.71% of the signals given by moving averages are bearish. Caution: the slightly bullish signals currently given by short-term moving averages could cause a reversal of the trend. An assessment of moving averages reveals several bullish signals that could impact this trend:
Bullish trend reversal : Moving Average 20
Type : Bullish
Timeframe : Daily
Bullish trend reversal : adaptative moving average 50
Type : Bullish
Timeframe : Daily
An assessment of technical indicators shows a strong bullish signal.
Caution: the Central Indicators scanner currently detects an excess:
CCI indicator is overbought : over 100
Type : Neutral
Timeframe : Daily
Williams %R indicator is overbought : over -20
Type : Neutral
Timeframe : Daily
Pivot points : price is over resistance 1
Type : Neutral
Timeframe : Weekly
SuperTrend indicator bullish reversal
Type : Bullish
Timeframe : Daily
Price is back over the pivot point
Type : Bullish
Timeframe : Daily
The Central Patterns scanner, which studies chart patterns, resistances and supports, has identified these signals:
Horizontal resistance is broken
Type : Bullish
Timeframe : Daily
Resistance of channel is broken
Type : Bullish
Timeframe : Daily
The Central Candlesticks scanner which studies Japanese candlesticks did not detect anything.
| S3 | S2 | S1 | Price | R1 | R2 | R3 | |
|---|---|---|---|---|---|---|---|
| ProTrendLines | 84.07 | 86.03 | 88.40 | 89.57 | 89.90 | 91.80 | 94.91 |
| Change (%) | -6.14% | -3.95% | -1.31% | - | +0.37% | +2.49% | +5.96% |
| Change | -5.50 | -3.54 | -1.17 | - | +0.33 | +2.23 | +5.34 |
| Level | Intermediate | Major | Intermediate | - | Intermediate | Intermediate | Major |
Pivot points can also be used to set your price objectives. Here is the price situation in relation to pivot points:
| Pivot points | S3 | S2 | S1 | PP | R1 | R2 | R3 |
|---|---|---|---|---|---|---|---|
| Standard | 85.91 | 86.83 | 88.31 | 89.23 | 90.71 | 91.63 | 93.11 |
| Camarilla | 89.12 | 89.34 | 89.56 | 89.78 | 90.00 | 90.22 | 90.44 |
| Woodie | 86.18 | 86.97 | 88.58 | 89.37 | 90.98 | 91.77 | 93.38 |
| Fibonacci | 86.83 | 87.75 | 88.32 | 89.23 | 90.15 | 90.72 | 91.63 |
| Pivot points | S3 | S2 | S1 | PP | R1 | R2 | R3 |
|---|---|---|---|---|---|---|---|
| Standard | 80.16 | 82.12 | 84.39 | 86.35 | 88.62 | 90.58 | 92.85 |
| Camarilla | 85.50 | 85.88 | 86.27 | 86.66 | 87.05 | 87.44 | 87.82 |
| Woodie | 80.32 | 82.20 | 84.55 | 86.43 | 88.78 | 90.66 | 93.01 |
| Fibonacci | 82.12 | 83.74 | 84.73 | 86.35 | 87.97 | 88.96 | 90.58 |
| Pivot points | S3 | S2 | S1 | PP | R1 | R2 | R3 |
|---|---|---|---|---|---|---|---|
| Standard | 71.63 | 78.64 | 82.69 | 89.70 | 93.75 | 100.76 | 104.81 |
| Camarilla | 83.69 | 84.70 | 85.72 | 86.73 | 87.74 | 88.76 | 89.77 |
| Woodie | 70.14 | 77.90 | 81.20 | 88.96 | 92.26 | 100.02 | 103.32 |
| Fibonacci | 78.64 | 82.87 | 85.48 | 89.70 | 93.93 | 96.54 | 100.76 |
Numerical data
The following is the status of the technical indicators and moving averages at the time of publication of this technical analysis:
| RSI (14): | 56.75 | |
| MACD (12,26,9): | -0.3100 | |
| Directional Movement: | 9.04 | |
| AROON (14): | 64.29 | |
| DEMA (21): | 86.86 | |
| Parabolic SAR (0,02-0,02-0,2): | 84.76 | |
| Elder Ray (13): | 2.76 | |
| Super Trend (3,10): | 84.53 | |
| Zig ZAG (10): | 89.57 | |
| VORTEX (21): | 1.0100 | |
| Stochastique (14,3,5): | 89.62 | |
| TEMA (21): | 87.58 | |
| Williams %R (14): | -21.82 | |
| Chande Momentum Oscillator (20): | 3.80 | |
| Repulse (5,40,3): | 1.4000 | |
| ROCnROLL: | 1 | |
| TRIX (15,9): | -0.1900 | |
| Courbe Coppock: | 3.85 |
| MA7: | 88.09 | |
| MA20: | 86.51 | |
| MA50: | 90.09 | |
| MA100: | 90.46 | |
| MAexp7: | 88.17 | |
| MAexp20: | 87.65 | |
| MAexp50: | 89.03 | |
| MAexp100: | 90.05 | |
| Price / MA7: | +1.68% | |
| Price / MA20: | +3.54% | |
| Price / MA50: | -0.58% | |
| Price / MA100: | -0.98% | |
| Price / MAexp7: | +1.59% | |
| Price / MAexp20: | +2.19% | |
| Price / MAexp50: | +0.61% | |
| Price / MAexp100: | -0.53% |
News
The latest news and videos published on CALAVO GROWERS INC. at the time of the analysis were as follows:
- 10/01/2019 - 13:00 Calavo Growers, Inc. Declares $1.10 Per Share Annual Cash Dividend
- 09/05/2019 - 13:00 Calavo Growers, Inc. Announces Fiscal 2019 Third Quarter Results
-
02/08/2017 - 17:28
 Calavo Growers
About author

Online


Add a comment
Comments
0 comments on the analysis CALAVO GROWERS INC. - Daily