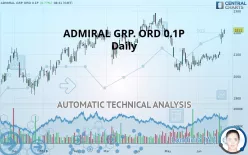
ADMIRAL GRP. ORD 0.1P - Daily - Technical analysis published on 06/26/2019 (GMT)
- 473
- 0
- Who voted?
Click here for a new analysis!
- Timeframe : Daily
- - Analysis generated on
- Status : TARGET REACHED

Summary of the analysis

Additional analysis
Quotes
The ADMIRAL GRP. ORD 0.1P price is 2,211.0 GBX. On the day, this instrument gained +0.78% and was traded between 2,194.0 GBX and 2,217.0 GBX over the period. The price is currently at +0.77% from its lowest and -0.27% from its highest.A study of price movements over other periods shows the following variations:
Near a new HIGH record (5 years)
Type : Bullish
Timeframe : Weekly
Near a new HIGH record (1st january)
Type : Bullish
Timeframe : Weekly
Technical
Technical analysis of this Daily chart of ADMIRAL GRP. ORD 0.1P indicates that the overall trend is strongly bullish. 85.71% of the signals given by moving averages are bullish. This strongly bullish trend is supported by the strong bullish signals given by short-term moving averages. The Central Indicators market scanner currently does not detect any result that concerns moving averages.
In fact, 14 technical indicators on 18 studied are currently bullish. Caution: the Central Indicators scanner currently detects an excess:
RSI indicator is overbought : over 70
Type : Neutral
Timeframe : Daily
CCI indicator is overbought : over 100
Type : Neutral
Timeframe : Daily
Previous candle closed over Bollinger bands
Type : Neutral
Timeframe : Daily
Williams %R indicator is overbought : over -20
Type : Neutral
Timeframe : Daily
Pivot points : price is over resistance 1
Type : Neutral
Timeframe : Daily
Pivot points : price is over resistance 3
Type : Neutral
Timeframe : Weekly
Central Patterns, the market scanner focusing on chart patterns, resistances and supports found this result:
Resistance of channel is broken
Type : Bullish
Timeframe : Daily
The Central Candlesticks scanner which studies Japanese candlesticks did not detect anything.
| S3 | S2 | S1 | Price | R1 | |
|---|---|---|---|---|---|
| ProTrendLines | 2,028.0 | 2,109.8 | 2,178.0 | 2,211.0 | 2,260.0 |
| Change (%) | -8.28% | -4.58% | -1.49% | - | +2.22% |
| Change | -183.0 | -101.2 | -33.0 | - | +49.0 |
| Level | Major | Major | Major | - | Major |
Attention could also be paid to pivot points to set price objectives:
| Pivot points | S3 | S2 | S1 | PP | R1 | R2 | R3 |
|---|---|---|---|---|---|---|---|
| Standard | 2,154.7 | 2,165.3 | 2,179.7 | 2,190.3 | 2,204.7 | 2,215.3 | 2,229.7 |
| Camarilla | 2,187.1 | 2,189.4 | 2,191.7 | 2,194.0 | 2,196.3 | 2,198.6 | 2,200.9 |
| Woodie | 2,156.5 | 2,166.2 | 2,181.5 | 2,191.2 | 2,206.5 | 2,216.2 | 2,231.5 |
| Fibonacci | 2,165.3 | 2,174.9 | 2,180.8 | 2,190.3 | 2,199.9 | 2,205.8 | 2,215.3 |
| Pivot points | S3 | S2 | S1 | PP | R1 | R2 | R3 |
|---|---|---|---|---|---|---|---|
| Standard | 2,052.3 | 2,064.7 | 2,088.3 | 2,100.7 | 2,124.3 | 2,136.7 | 2,160.3 |
| Camarilla | 2,102.1 | 2,105.4 | 2,108.7 | 2,112.0 | 2,115.3 | 2,118.6 | 2,121.9 |
| Woodie | 2,058.0 | 2,067.5 | 2,094.0 | 2,103.5 | 2,130.0 | 2,139.5 | 2,166.0 |
| Fibonacci | 2,064.7 | 2,078.4 | 2,086.9 | 2,100.7 | 2,114.4 | 2,122.9 | 2,136.7 |
Numerical data
The following is the status of technical indicators and moving averages registered at the time this technical analysis was created:
| RSI (14): | 73.90 | |
| MACD (12,26,9): | 22.7000 | |
| Directional Movement: | 30.8 | |
| AROON (14): | 57.1 | |
| DEMA (21): | 2,138.1 | |
| Parabolic SAR (0,02-0,02-0,2): | 2,062.7 | |
| Elder Ray (13): | 75.7 | |
| Super Trend (3,10): | 2,116.2 | |
| Zig ZAG (10): | 2,209.0 | |
| VORTEX (21): | 1.2000 | |
| Stochastique (14,3,5): | 87.70 | |
| TEMA (21): | 2,163.8 | |
| Williams %R (14): | -5.30 | |
| Chande Momentum Oscillator (20): | 120.0 | |
| Repulse (5,40,3): | 2.0000 | |
| ROCnROLL: | 1 | |
| TRIX (15,9): | 0.0000 | |
| Courbe Coppock: | 6.60 |
| MA7: | 2,140.6 | |
| MA20: | 2,101.4 | |
| MA50: | 2,105.1 | |
| MA100: | 2,102.2 | |
| MAexp7: | 2,157.1 | |
| MAexp20: | 2,115.7 | |
| MAexp50: | 2,101.7 | |
| MAexp100: | 2,083.0 | |
| Price / MA7: | +3.29% | |
| Price / MA20: | +5.22% | |
| Price / MA50: | +5.03% | |
| Price / MA100: | +5.18% | |
| Price / MAexp7: | +2.50% | |
| Price / MAexp20: | +4.50% | |
| Price / MAexp50: | +5.20% | |
| Price / MAexp100: | +6.14% |
News
Don"t forget to follow the news on ADMIRAL GRP. ORD 0.1P. At the time of publication of this analysis, the latest news was as follows:
- Admiral Group PLC : Holding(s) in Company
- Admiral Group PLC : Holding(s) in Company
- Admiral Group PLC : Director/PDMR Shareholding
- Admiral Group PLC : Holding(s) in Company
- Admiral Group PLC : Notice of Results
About author

Online


Add a comment
Comments
0 comments on the analysis ADMIRAL GRP. ORD 0.1P - Daily