PREDILIFE - Daily - Technical analysis published on 01/09/2025 (GMT)
- 76
- 0
Click here for a new analysis!
- Timeframe : Daily
- - Analysis generated on
- Status : INVALID
Summary of the analysis

Additional analysis
Quotes
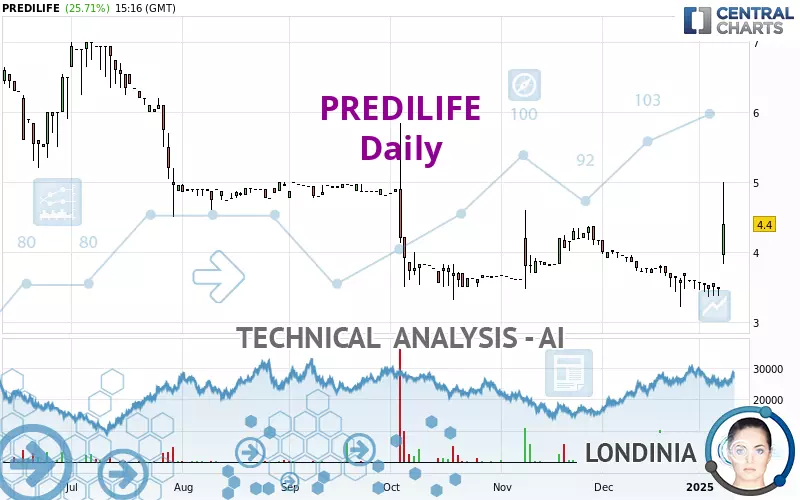
PREDILIFE rating 4.40 EUR. The price has increased by +25.71% since the last closing with the lowest point at 3.84 EUR and the highest point at 5.00 EUR. The deviation from the price is +14.58% for the low point and -12.00% for the high point.A bullish gap was detected at the opening by the Central Gaps scanner. There are a lot of buyers and they have the upper hand in the very short term.
Opening Gap UP
Type : Bullish
Timeframe : Openning
So that you have an overall view of the price change, here is a table showing the variations over several periods:
Near a new LOW record (5 years)
Type : Bearish
Timeframe : Weekly
New HIGH record (1st january)
Type : Bullish
Timeframe : Weekly
New HIGH record (1 month)
Type : Bullish
Timeframe : Weekly
The Central Volumes scanner detects abnormal volumes on the asset:
Abnormal volumes
Timeframe : 5 days
Technical
Technical analysis of this Daily chart of PREDILIFE indicates that the overall trend is slightly bullish. Only 60.71% of the signals given by moving averages are bullish. This slightly bullish trend is reinforced by the strong signals currently being given by short-term moving averages. The Central Indicators scanner detects bullish signals on moving averages that could impact this trend:
Bullish price crossover with Moving Average 20
Type : Bullish
Timeframe : Daily
Bullish price crossover with Moving Average 50
Type : Bullish
Timeframe : Daily
Bullish price crossover with Moving Average 100
Type : Bullish
Timeframe : Daily
Bullish price crossover with adaptative moving average 20
Type : Bullish
Timeframe : Daily
Bullish price crossover with adaptative moving average 50
Type : Bullish
Timeframe : Daily
Bullish price crossover with adaptative moving average 100
Type : Bullish
Timeframe : Daily
In fact, according to the parameters integrated into the Central Analyzer system, 14 technical indicators out of 18 analysed are currently bullish. Caution: the Central Indicators scanner currently detects an excess:
RSI indicator is overbought : over 70
Type : Neutral
Timeframe : Daily
CCI indicator is overbought : over 100
Type : Neutral
Timeframe : Daily
Pivot points : price is over resistance 3
Type : Neutral
Timeframe : Daily
Pivot points : price is over resistance 3
Type : Neutral
Timeframe : Weekly
MACD crosses UP its Moving Average
Type : Bullish
Timeframe : Daily
Parabolic SAR indicator bullish reversal
Type : Bullish
Timeframe : Daily
Aroon indicator bullish trend
Type : Bullish
Timeframe : Daily
SuperTrend indicator bullish reversal
Type : Bullish
Timeframe : Daily
Ichimoku - Bullish crossover : Tenkan & Kijun
Type : Bullish
Timeframe : Daily
Momentum indicator is back over 0
Type : Bullish
Timeframe : Daily
Williams %R indicator is back over -50
Type : Bullish
Timeframe : Daily
No signals are given by Central Patterns, a market scanner specialised in chart patterns, resistances and supports.
For a small rebound in the very short term, the Central Candlesticks scanner currently notes the presence of these bullish patterns in Japanese candlesticks:
Upside gap
Type : Bullish
Timeframe : Daily
Long white line
Type : Bullish
Timeframe : Daily
| S1 | Price | R1 | R2 | R3 | |
|---|---|---|---|---|---|
| ProTrendLines | 3.80 | 4.40 | 4.96 | 6.26 | 7.28 |
| Change (%) | -13.64% | - | +12.73% | +42.27% | +65.45% |
| Change | -0.60 | - | +0.56 | +1.86 | +2.88 |
| Level | Intermediate | - | Intermediate | Major | Minor |
Attention could also be paid to pivot points to set price objectives:
| Pivot points | S3 | S2 | S1 | PP | R1 | R2 | R3 |
|---|---|---|---|---|---|---|---|
| Standard | 3.30 | 3.34 | 3.42 | 3.46 | 3.54 | 3.58 | 3.66 |
| Camarilla | 3.47 | 3.48 | 3.49 | 3.50 | 3.51 | 3.52 | 3.53 |
| Woodie | 3.32 | 3.35 | 3.44 | 3.47 | 3.56 | 3.59 | 3.68 |
| Fibonacci | 3.34 | 3.39 | 3.41 | 3.46 | 3.51 | 3.53 | 3.58 |
| Pivot points | S3 | S2 | S1 | PP | R1 | R2 | R3 |
|---|---|---|---|---|---|---|---|
| Standard | 3.31 | 3.37 | 3.47 | 3.53 | 3.63 | 3.69 | 3.79 |
| Camarilla | 3.52 | 3.53 | 3.55 | 3.56 | 3.58 | 3.59 | 3.60 |
| Woodie | 3.32 | 3.38 | 3.48 | 3.54 | 3.64 | 3.70 | 3.80 |
| Fibonacci | 3.37 | 3.43 | 3.47 | 3.53 | 3.59 | 3.63 | 3.69 |
| Pivot points | S3 | S2 | S1 | PP | R1 | R2 | R3 |
|---|---|---|---|---|---|---|---|
| Standard | 2.19 | 2.71 | 3.15 | 3.67 | 4.11 | 4.63 | 5.07 |
| Camarilla | 3.34 | 3.42 | 3.51 | 3.60 | 3.69 | 3.78 | 3.86 |
| Woodie | 2.16 | 2.69 | 3.12 | 3.65 | 4.08 | 4.61 | 5.04 |
| Fibonacci | 2.71 | 3.07 | 3.30 | 3.67 | 4.03 | 4.26 | 4.63 |
Numerical data
The following are the details of the technical indicators and moving averages that were collected to generate this technical analysis:
| RSI (14): | 75.38 | |
| MACD (12,26,9): | -0.0200 | |
| Directional Movement: | 32.45 | |
| AROON (14): | 64.29 | |
| DEMA (21): | 3.70 | |
| Parabolic SAR (0,02-0,02-0,2): | 3.22 | |
| Elder Ray (13): | 0.68 | |
| Super Trend (3,10): | 3.56 | |
| Zig ZAG (10): | 4.60 | |
| VORTEX (21): | 0.8600 | |
| Stochastique (14,3,5): | 53.21 | |
| TEMA (21): | 3.68 | |
| Williams %R (14): | -33.71 | |
| Chande Momentum Oscillator (20): | 0.70 | |
| Repulse (5,40,3): | 8.9300 | |
| ROCnROLL: | 1 | |
| TRIX (15,9): | -0.3400 | |
| Courbe Coppock: | 3.92 |
| MA7: | 3.66 | |
| MA20: | 3.70 | |
| MA50: | 3.84 | |
| MA100: | 4.16 | |
| MAexp7: | 3.76 | |
| MAexp20: | 3.75 | |
| MAexp50: | 3.88 | |
| MAexp100: | 4.19 | |
| Price / MA7: | +20.22% | |
| Price / MA20: | +18.92% | |
| Price / MA50: | +14.58% | |
| Price / MA100: | +5.77% | |
| Price / MAexp7: | +17.02% | |
| Price / MAexp20: | +17.33% | |
| Price / MAexp50: | +13.40% | |
| Price / MAexp100: | +5.01% |
News
The last news published on PREDILIFE at the time of the generation of this analysis was as follows:
- PREDILIFE STRENGTHENS ITS ASSETS WITH THE ISSUANCE OF A PATENT FOR ITS AI METHOD
- IN EXTENSO FINANCE UPDATES COVERAGE ON PREDILIFE STOCK; TARGET PRICE OF EUR 25.07 REPRESENTS +391% POTENTIAL UPSIDE
- Valuation of MammoRisk(R) software
About author
Online


Add a comment
Comments
0 comments on the analysis PREDILIFE - Daily