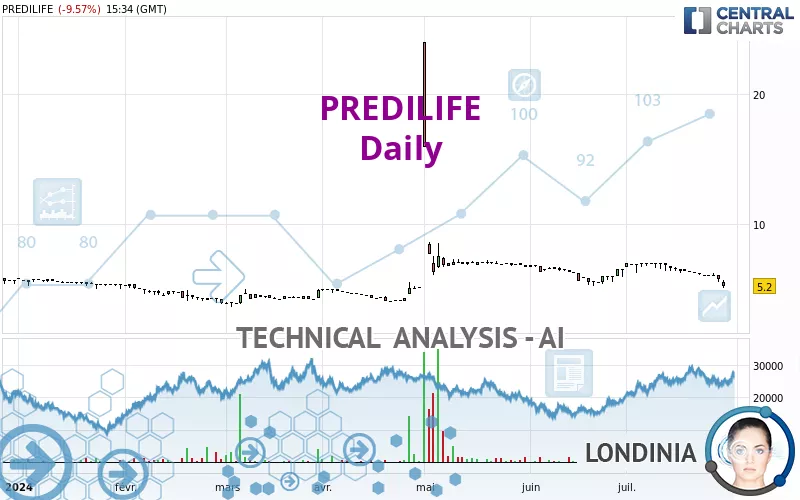
PREDILIFE - Daily - Technical analysis published on 07/29/2024 (GMT)
- 107
- 0
Click here for a new analysis!
- Timeframe : Daily
- - Analysis generated on
- Status : TARGET REACHED
Summary of the analysis

Additional analysis
Quotes
The PREDILIFE rating is 5.20 EUR. The price is lower by -9.57% since the last closing and was traded between 5.05 EUR and 5.70 EUR over the period. The price is currently at +2.97% from its lowest and -8.77% from its highest.The Central Gaps scanner detects a bearish opening. A small advantage for sellers in the very short term.
Bearish opening
Type : Bearish
Timeframe : Openning
A study of price movements over other periods shows the following variations:
New LOW record (1 month)
Type : Bearish
Timeframe : Weekly
Technical
Technical analysis of PREDILIFE in Daily shows an overall slightly bearish trend. 60.71% of the signals given by moving averages are bearish. This bearish trend does not seem to be increasing given the slightly bearish signals given by short-term moving averages. The Central Indicators scanner does not detect any result on moving averages that would impact this trend.
The probability of a further decline is moderate given the direction of the technical indicators.
Caution: the Central Indicators scanner currently detects an excess:
RSI indicator is oversold : under 30
Type : Neutral
Timeframe : Daily
CCI indicator is oversold : under -100
Type : Neutral
Timeframe : Daily
Williams %R indicator is oversold : under -80
Type : Neutral
Timeframe : Daily
Pivot points : price is under support 1
Type : Neutral
Timeframe : Daily
Pivot points : price is under support 1
Type : Neutral
Timeframe : Weekly
The analysis of the price chart with Central Patterns scanners does not return any result.
The Central Candlesticks scanner which studies Japanese candlesticks did not detect anything.
| S1 | Price | R1 | R2 | R3 | |
|---|---|---|---|---|---|
| ProTrendLines | 3.80 | 5.20 | 5.52 | 7.28 | 9.20 |
| Change (%) | -26.92% | - | +6.15% | +40.00% | +76.92% |
| Change | -1.40 | - | +0.32 | +2.08 | +4.00 |
| Level | Intermediate | - | Major | Intermediate | Minor |
To determine price objectives, it is also possible to use the pivot points. Here is the price position in relation to pivot points:
| Pivot points | S3 | S2 | S1 | PP | R1 | R2 | R3 |
|---|---|---|---|---|---|---|---|
| Standard | 4.28 | 4.67 | 4.93 | 5.32 | 5.58 | 5.97 | 6.23 |
| Camarilla | 5.02 | 5.08 | 5.14 | 5.20 | 5.26 | 5.32 | 5.38 |
| Woodie | 4.23 | 4.64 | 4.88 | 5.29 | 5.53 | 5.94 | 6.18 |
| Fibonacci | 4.67 | 4.92 | 5.07 | 5.32 | 5.57 | 5.72 | 5.97 |
| Pivot points | S3 | S2 | S1 | PP | R1 | R2 | R3 |
|---|---|---|---|---|---|---|---|
| Standard | 4.73 | 5.12 | 5.43 | 5.82 | 6.13 | 6.52 | 6.83 |
| Camarilla | 5.56 | 5.62 | 5.69 | 5.75 | 5.81 | 5.88 | 5.94 |
| Woodie | 4.70 | 5.10 | 5.40 | 5.80 | 6.10 | 6.50 | 6.80 |
| Fibonacci | 5.12 | 5.38 | 5.55 | 5.82 | 6.08 | 6.25 | 6.52 |
| Pivot points | S3 | S2 | S1 | PP | R1 | R2 | R3 |
|---|---|---|---|---|---|---|---|
| Standard | 3.87 | 4.53 | 5.52 | 6.18 | 7.17 | 7.83 | 8.82 |
| Camarilla | 6.05 | 6.20 | 6.35 | 6.50 | 6.65 | 6.80 | 6.95 |
| Woodie | 4.03 | 4.61 | 5.68 | 6.26 | 7.33 | 7.91 | 8.98 |
| Fibonacci | 4.53 | 5.16 | 5.55 | 6.18 | 6.81 | 7.20 | 7.83 |
Numerical data
The following is the status of the technical indicators and moving averages at the time of publication of this technical analysis:
| RSI (14): | 26.19 | |
| MACD (12,26,9): | -0.2100 | |
| Directional Movement: | -28.79 | |
| AROON (14): | -100.00 | |
| DEMA (21): | 6.01 | |
| Parabolic SAR (0,02-0,02-0,2): | 6.97 | |
| Elder Ray (13): | -0.72 | |
| Super Trend (3,10): | 6.37 | |
| Zig ZAG (10): | 5.20 | |
| VORTEX (21): | 0.8000 | |
| Stochastique (14,3,5): | 11.89 | |
| TEMA (21): | 5.79 | |
| Williams %R (14): | -92.11 | |
| Chande Momentum Oscillator (20): | -1.60 | |
| Repulse (5,40,3): | -11.9100 | |
| ROCnROLL: | 2 | |
| TRIX (15,9): | -0.1400 | |
| Courbe Coppock: | 28.10 |
| MA7: | 5.94 | |
| MA20: | 6.46 | |
| MA50: | 6.46 | |
| MA100: | 5.90 | |
| MAexp7: | 5.87 | |
| MAexp20: | 6.22 | |
| MAexp50: | 6.28 | |
| MAexp100: | 6.06 | |
| Price / MA7: | -12.46% | |
| Price / MA20: | -19.50% | |
| Price / MA50: | -19.50% | |
| Price / MA100: | -11.86% | |
| Price / MAexp7: | -11.41% | |
| Price / MAexp20: | -16.40% | |
| Price / MAexp50: | -17.20% | |
| Price / MAexp100: | -14.19% |
News
Don't forget to follow the news on PREDILIFE. At the time of publication of this analysis, the latest news was as follows:
- PREDILIFE STRENGTHENS ITS ASSETS WITH THE ISSUANCE OF A PATENT FOR ITS AI METHOD
- IN EXTENSO FINANCE UPDATES COVERAGE ON PREDILIFE STOCK; TARGET PRICE OF EUR 25.07 REPRESENTS +391% POTENTIAL UPSIDE
- Valuation of MammoRisk(R) software
About author

Online


Add a comment
Comments
0 comments on the analysis PREDILIFE - Daily