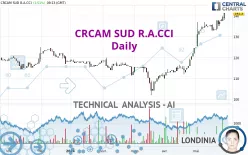
CRCAM SUD R.A.CCI - Daily - Technical analysis published on 05/29/2024 (GMT)
- 105
- 0
Click here for a new analysis!
- Timeframe : Daily
- - Analysis generated on
- Status : INVALID

Summary of the analysis

Additional analysis
Quotes
The CRCAM SUD R.A.CCI price is 141.30 EUR. The price has increased by +1.51% since the last closing and was traded between 138.00 EUR and 141.30 EUR over the period. The price is currently at +2.39% from its lowest and 0% from its highest.The Central Gaps scanner detects a bearish opening marking the presence of sellers ahead of buyers at the opening but not sufficiently marked to allow the price to register a quotation gap.
Bearish opening
Type : Bearish
Timeframe : Openning
A study of price movements over other periods shows the following variations:
New HIGH record (1 year)
Type : Bullish
Timeframe : Weekly
New HIGH record (1st january)
Type : Bullish
Timeframe : Weekly
New HIGH record (1 month)
Type : Bullish
Timeframe : Weekly
Abnormal volumes on CRCAM SUD R.A.CCI were detected by the Central Volumes scanner:
Abnormal volumes
Timeframe : 5 days
Technical
Technical analysis of this Daily chart of CRCAM SUD R.A.CCI indicates that the overall trend is strongly bullish. The signals given by the moving averages are 92.86% bullish. This strong bullish trend is confirmed by the strong signals currently being given by short-term moving averages. The Central Indicators market scanner currently does not detect any result that concerns moving averages.
In fact, 12 technical indicators on 18 studied are currently positioned bullish. Caution: the Central Indicators scanner currently detects an excess:
RSI indicator is overbought : over 70
Type : Neutral
Timeframe : Daily
CCI indicator is overbought : over 100
Type : Neutral
Timeframe : Daily
Williams %R indicator is overbought : over -20
Type : Neutral
Timeframe : Daily
Pivot points : price is over resistance 1
Type : Neutral
Timeframe : Daily
Pivot points : price is over resistance 2
Type : Neutral
Timeframe : Weekly
An analysis of the price chart with the Central Patterns scanner (detector of chart patterns and resistances and supports) shows a result that can have an impact on the price change:
Resistance of channel is broken
Type : Bullish
Timeframe : Daily
Central Candlesticks, the scanner specialised in Japanese candlesticks, detects a bullish signal that could support the hypothesis of a small rebound in the very short term:
Three white soldiers
Type : Bullish
Timeframe : Daily
| S3 | S2 | S1 | Price | R1 | R2 | R3 | |
|---|---|---|---|---|---|---|---|
| ProTrendLines | 124.00 | 127.88 | 136.50 | 141.30 | 145.67 | 152.75 | 163.10 |
| Change (%) | -12.24% | -9.50% | -3.40% | - | +3.09% | +8.10% | +15.43% |
| Change | -17.30 | -13.42 | -4.80 | - | +4.37 | +11.45 | +21.80 |
| Level | Intermediate | Minor | Major | - | Minor | Minor | Intermediate |
Pivot points can also be used to set your price objectives. Here is the price situation in relation to pivot points:
| Pivot points | S3 | S2 | S1 | PP | R1 | R2 | R3 |
|---|---|---|---|---|---|---|---|
| Standard | 135.47 | 136.53 | 137.87 | 138.93 | 140.27 | 141.33 | 142.67 |
| Camarilla | 138.54 | 138.76 | 138.98 | 139.20 | 139.42 | 139.64 | 139.86 |
| Woodie | 135.60 | 136.60 | 138.00 | 139.00 | 140.40 | 141.40 | 142.80 |
| Fibonacci | 136.53 | 137.45 | 138.02 | 138.93 | 139.85 | 140.42 | 141.33 |
| Pivot points | S3 | S2 | S1 | PP | R1 | R2 | R3 |
|---|---|---|---|---|---|---|---|
| Standard | 129.43 | 131.21 | 134.11 | 135.89 | 138.79 | 140.57 | 143.47 |
| Camarilla | 135.71 | 136.14 | 136.57 | 137.00 | 137.43 | 137.86 | 138.29 |
| Woodie | 129.98 | 131.49 | 134.66 | 136.17 | 139.34 | 140.85 | 144.02 |
| Fibonacci | 131.21 | 133.00 | 134.11 | 135.89 | 137.68 | 138.79 | 140.57 |
| Pivot points | S3 | S2 | S1 | PP | R1 | R2 | R3 |
|---|---|---|---|---|---|---|---|
| Standard | 100.33 | 105.17 | 114.83 | 119.67 | 129.33 | 134.17 | 143.83 |
| Camarilla | 120.51 | 121.84 | 123.17 | 124.50 | 125.83 | 127.16 | 128.49 |
| Woodie | 102.75 | 106.38 | 117.25 | 120.88 | 131.75 | 135.38 | 146.25 |
| Fibonacci | 105.17 | 110.71 | 114.13 | 119.67 | 125.21 | 128.63 | 134.17 |
Numerical data
The following is the status of technical indicators and moving averages registered at the time this technical analysis was created:
| RSI (14): | 80.32 | |
| MACD (12,26,9): | 4.7400 | |
| Directional Movement: | 42.20 | |
| AROON (14): | 35.71 | |
| DEMA (21): | 139.97 | |
| Parabolic SAR (0,02-0,02-0,2): | 135.43 | |
| Elder Ray (13): | 3.64 | |
| Super Trend (3,10): | 133.17 | |
| Zig ZAG (10): | 141.30 | |
| VORTEX (21): | 1.3100 | |
| Stochastique (14,3,5): | 93.16 | |
| TEMA (21): | 141.03 | |
| Williams %R (14): | 0.00 | |
| Chande Momentum Oscillator (20): | 5.66 | |
| Repulse (5,40,3): | 4.1200 | |
| ROCnROLL: | 1 | |
| TRIX (15,9): | 0.5800 | |
| Courbe Coppock: | 8.36 |
| MA7: | 137.55 | |
| MA20: | 134.81 | |
| MA50: | 122.02 | |
| MA100: | 119.00 | |
| MAexp7: | 138.02 | |
| MAexp20: | 133.56 | |
| MAexp50: | 126.29 | |
| MAexp100: | 122.51 | |
| Price / MA7: | +2.73% | |
| Price / MA20: | +4.81% | |
| Price / MA50: | +15.80% | |
| Price / MA100: | +18.74% | |
| Price / MAexp7: | +2.38% | |
| Price / MAexp20: | +5.80% | |
| Price / MAexp50: | +11.89% | |
| Price / MAexp100: | +15.34% |
News
The last news published on CRCAM SUD R.A.CCI at the time of the generation of this analysis was as follows:
- CRCAM SUD RHONE ALPES: AVIS DE MISE A DISPOSITION RAPPORT FINANCIER SEMESTRIEL - 1er semestre 2021
- Crcam SUD RHONE ALPES: Avis de mise à disposition du prospectus 2021
- Crcam Sud Rhone Alpes : Avis de modification des résolutions d'affectation du résultat
- Caisse Regionale de Credit Agricole Sud Rhone Alpes: Communiqué Financier
- Crcam Sud Rhone Alpes : Communiqué de mise à disposition du rapport financier semestriel - 1er semestre 2019
About author
Online


Add a comment
Comments
0 comments on the analysis CRCAM SUD R.A.CCI - Daily