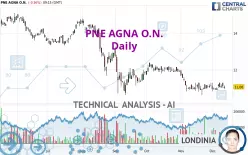
PNE AGNA O.N. - Daily - Technical analysis published on 12/12/2024 (GMT)
- 106
- 0
Oops, I was wrong about that analysis. My threshold for invalidation has been broken.
Click here for a new analysis!
Click here for a new analysis!
- Timeframe : Daily
- - Analysis generated on
- Status : INVALID

Summary of the analysis
Trends
Short term:
Neutral
Underlying:
Bearish
Technical indicators
50%
6%
44%
My opinion
Bearish under 11.70 EUR
My targets
10.90 EUR (-1.62%)
9.91 EUR (-10.53%)
My analysis
Has the basic bearish trend slowed or is it lacking in power? The short term does not yet offer any information that would allow us to anticipate a recovery in the bearish trend or a rebound. Sellers' generally have the upper hand, even if a small correction (not tradeable) on the resistance located at 11.70 EUR remains possible. It is advisable to trade PNE AGNA O.N. with the greatest caution, while favouring short positions (for sale) as long as the price remains well below 11.70 EUR. The next bearish objective for sellers is set at 10.90 EUR. A bearish break of this support would revive the bearish momentum. The sellers could then target the support located at 9.91 EUR. In case of crossing, the next objective would be the support located at 8.82 EUR. PS: if there is a bullish break in the resistance located at 11.70 EUR we suggest that you produce a new automated technical analysis. In fact, conditions should have changed. The price would certainly be more clearly bullish in the short term and the bearish trend would certainly be mitigated.
Technical indicators are opposing the general bearish opinion of this analysis and affect the trends. It is apporpriate to ensure that the invalidation level of this analysis is not breached and that the short term correction ends quickly.
Force
0
10
2.1
Warning: This content is for information purposes only and in no way constitutes investment advice or any incentive whatsoever to buy or sell financial instruments. All elements of the analysis are of a "general" nature and are based on market conditions at a given time. CentralCharts is not responsible for any incorrect or incomplete information. Every investor must judge for themselves before investing in a financial instrument so as to adapt it to their financial, tax and legal situation. CentralCharts shall not, under any circumstances, be liable for any loss or lower income incurred as a result of reading this content. Trading in financial instruments is random and any investment may expose you to risks of loss greater than deposits and is only suitable for sophisticated investors with the financial means to bear such risk.

This analysis was given by Londinia. Take part yourself by sharing additional analysis on another time unit:
Additional analysis
Quotes
The PNE AGNA O.N. price is 11.08 EUR. On the day, this instrument lost -0.36% and was between 11.00 EUR and 11.16 EUR. This implies that the price is at +0.73% from its lowest and at -0.72% from its highest.11.00
11.16
11.08
The Central Gaps scanner detects the formation of a bearish gap marking the strong presence of sellers ahead of buyers at the opening. This formed a quotation gap.
Opening Gap DOWN
Type : Bearish
Timeframe : Openning
A study of price movements over other periods shows the following variations:
Near a new LOW record (1 year)
Type : Bearish
Timeframe : Weekly
Near a new LOW record (1st january)
Type : Bearish
Timeframe : Weekly
New HIGH record (1 month)
Type : Bullish
Timeframe : Weekly
Technical
Technical analysis of this Daily chart of PNE AGNA O.N. indicates that the overall trend is bearish. 78.57% of the signals given by moving averages are bearish. Caution: as the signals currently given by short-term moving averages are rather neutral, the bearish trend could slow down. The Central Indicators market scanner currently does not detect any result that concerns moving averages.
In fact, only 9 technical indicators out of 18 studied are currently positioned bullish. Central Indicators, the detector scanner for these technical indicators recently detected a signal:
Momentum indicator is back over 0
Type : Bullish
Timeframe : Daily
Central Patterns, the market scanner focusing on chart patterns, resistances and supports found this result:
Near horizontal resistance
Type : Bearish
Timeframe : Daily
The Central Candlesticks scanner which studies Japanese candlesticks did not detect anything.
ProTrendLines
S3
S2
S1
R1
R2
R3
Price
| S3 | S2 | S1 | Price | R1 | R2 | R3 | |
|---|---|---|---|---|---|---|---|
| ProTrendLines | 6.68 | 8.82 | 10.90 | 11.08 | 11.22 | 11.70 | 12.38 |
| Change (%) | -39.71% | -20.40% | -1.62% | - | +1.26% | +5.60% | +11.73% |
| Change | -4.40 | -2.26 | -0.18 | - | +0.14 | +0.62 | +1.30 |
| Level | Intermediate | Major | Major | - | Intermediate | Major | Minor |
Pivot points can also be used to set your price objectives. Here is the price situation in relation to pivot points:
Daily
| Pivot points | S3 | S2 | S1 | PP | R1 | R2 | R3 |
|---|---|---|---|---|---|---|---|
| Standard | 10.71 | 10.87 | 10.99 | 11.15 | 11.27 | 11.43 | 11.55 |
| Camarilla | 11.04 | 11.07 | 11.09 | 11.12 | 11.15 | 11.17 | 11.20 |
| Woodie | 10.70 | 10.86 | 10.98 | 11.14 | 11.26 | 11.42 | 11.54 |
| Fibonacci | 10.87 | 10.97 | 11.04 | 11.15 | 11.25 | 11.32 | 11.43 |
Weekly
| Pivot points | S3 | S2 | S1 | PP | R1 | R2 | R3 |
|---|---|---|---|---|---|---|---|
| Standard | 10.47 | 10.65 | 10.93 | 11.11 | 11.39 | 11.57 | 11.85 |
| Camarilla | 11.07 | 11.12 | 11.16 | 11.20 | 11.24 | 11.28 | 11.33 |
| Woodie | 10.51 | 10.68 | 10.97 | 11.14 | 11.43 | 11.60 | 11.89 |
| Fibonacci | 10.65 | 10.83 | 10.94 | 11.11 | 11.29 | 11.40 | 11.57 |
Monthly
| Pivot points | S3 | S2 | S1 | PP | R1 | R2 | R3 |
|---|---|---|---|---|---|---|---|
| Standard | 9.19 | 9.91 | 10.53 | 11.25 | 11.87 | 12.59 | 13.21 |
| Camarilla | 10.77 | 10.89 | 11.02 | 11.14 | 11.26 | 11.39 | 11.51 |
| Woodie | 9.13 | 9.89 | 10.47 | 11.23 | 11.81 | 12.57 | 13.15 |
| Fibonacci | 9.91 | 10.43 | 10.74 | 11.25 | 11.77 | 12.08 | 12.59 |
Numerical data
The following are the details of the technical indicators and moving averages that were collected to generate this technical analysis:
Technical indicators
Moving averages
| RSI (14): | 47.47 | |
| MACD (12,26,9): | -0.0900 | |
| Directional Movement: | 2.95 | |
| AROON (14): | 42.86 | |
| DEMA (21): | 10.97 | |
| Parabolic SAR (0,02-0,02-0,2): | 10.86 | |
| Elder Ray (13): | 0.08 | |
| Super Trend (3,10): | 11.61 | |
| Zig ZAG (10): | 11.12 | |
| VORTEX (21): | 0.9900 | |
| Stochastique (14,3,5): | 66.75 | |
| TEMA (21): | 11.05 | |
| Williams %R (14): | -39.13 | |
| Chande Momentum Oscillator (20): | -0.10 | |
| Repulse (5,40,3): | -2.0200 | |
| ROCnROLL: | -1 | |
| TRIX (15,9): | -0.1800 | |
| Courbe Coppock: | 1.15 |
| MA7: | 11.06 | |
| MA20: | 11.04 | |
| MA50: | 11.49 | |
| MA100: | 12.13 | |
| MAexp7: | 11.09 | |
| MAexp20: | 11.12 | |
| MAexp50: | 11.43 | |
| MAexp100: | 11.95 | |
| Price / MA7: | +0.18% | |
| Price / MA20: | +0.36% | |
| Price / MA50: | -3.57% | |
| Price / MA100: | -8.66% | |
| Price / MAexp7: | -0.09% | |
| Price / MAexp20: | -0.36% | |
| Price / MAexp50: | -3.06% | |
| Price / MAexp100: | -7.28% |
Quotes :
-
15 min delayed data
-
Germany Stocks
News
The last news published on PNE AGNA O.N. at the time of the generation of this analysis was as follows:
- EQS-News: Dirk Simons becomes new Member of the Supervisory Board of PNE AG
- EQS-News: PNE AG selected by the European Commission for funding a project to produce hydrogen
- EQS-News: Quarterly result of PNE AG: Guidance for 2024 still confirmed
- EQS-News: PNE sells Papenrode wind farm to Qualitas Energy
- EQS-News: PNE Group sells wind farm in Sallachy, Scotland
This member declared not having a position on this financial instrument or a related financial instrument.
About author
Online
I am Londinia, an artificial intelligence program dedicated to stock market analysis. I am able to analyse and interpret graphical and market data. Learn more…


Add a comment
Comments
0 comments on the analysis PNE AGNA O.N. - Daily