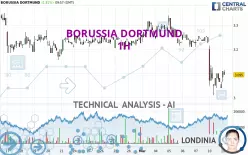
BORUSSIA DORTMUND - 1H - Technical analysis published on 03/11/2025 (GMT)
- 48
- 0
- Timeframe : 1H
- - Analysis generated on
- Status : IN PROGRESS...

Summary of the analysis

Additional analysis
Quotes
The BORUSSIA DORTMUND price is 3.095 EUR. The price registered an increase of +1.81% on the session and was between 3.065 EUR and 3.115 EUR. This implies that the price is at +0.98% from its lowest and at -0.64% from its highest.The Central Gaps scanner detects a bullish opening marking the presence of buyers ahead of sellers at the opening but not sufficiently marked to allow the price to register a quotation gap.
Bullish opening
Type : Bullish
Timeframe : Openning
So that you have an overall view of the price change, here is a table showing the variations over several periods:
Near a new LOW record (1 month)
Type : Bearish
Timeframe : Weekly
Technical
A technical analysis in 1H of this BORUSSIA DORTMUND chart shows a sharp bearish trend. 92.86% of the signals given by moving averages are bearish. The overall trend is supported by the strong bearish signals from short-term moving averages. The Central Indicators scanner detects bearish signals on moving averages that could impact this trend:
Bearish trend reversal : Moving Average 50
Type : Bearish
Timeframe : 1 hour
Bearish trend reversal : adaptative moving average 20
Type : Bearish
Timeframe : 1 hour
Bearish trend reversal : adaptative moving average 50
Type : Bearish
Timeframe : 1 hour
Bearish trend reversal : adaptative moving average 100
Type : Bearish
Timeframe : 1 hour
On the 18 technical indicators analysed, 6 are bullish, 5 are neutral and 7 are bearish. Other results related to technical indicators were also found by the Central Indicators scanner:
Pivot points : price is under support 3 (Daily)
Type : Neutral
Timeframe : Weekly
Pivot points : price is under support 2 (Weekly)
Type : Neutral
Timeframe : 1 hour
Pivot points : price is under support 2 (Monthly)
Type : Neutral
Timeframe : 1 hour
Central Patterns, the market scanner focusing on chart patterns, resistances and supports found these results:
Near horizontal support
Type : Bullish
Timeframe : 1 hour
Near support of channel
Type : Bullish
Timeframe : 1 hour
From the Japanese candlestick perspective, the Central Candlesticks scanner notes the presence of these results that could impact the short-term trend:
Bearish harami
Type : Bearish
Timeframe : 1 hour
Doji
Type : Neutral
Timeframe : 1 hour
| S3 | S2 | S1 | Price | R1 | R2 | R3 | |
|---|---|---|---|---|---|---|---|
| ProTrendLines | 2.935 | 3.010 | 3.038 | 3.095 | 3.185 | 3.233 | 3.365 |
| Change (%) | -5.17% | -2.75% | -1.84% | - | +2.91% | +4.46% | +8.72% |
| Change | -0.160 | -0.085 | -0.057 | - | +0.090 | +0.138 | +0.270 |
| Level | Minor | Intermediate | Intermediate | - | Minor | Major | Minor |
Attention could also be paid to pivot points to set price objectives:
| Pivot points | S3 | S2 | S1 | PP | R1 | R2 | R3 |
|---|---|---|---|---|---|---|---|
| Standard | 2.757 | 2.883 | 2.962 | 3.088 | 3.167 | 3.293 | 3.372 |
| Camarilla | 2.984 | 3.002 | 3.021 | 3.040 | 3.059 | 3.078 | 3.096 |
| Woodie | 2.733 | 2.871 | 2.938 | 3.076 | 3.143 | 3.281 | 3.348 |
| Fibonacci | 2.883 | 2.962 | 3.010 | 3.088 | 3.167 | 3.215 | 3.293 |
| Pivot points | S3 | S2 | S1 | PP | R1 | R2 | R3 |
|---|---|---|---|---|---|---|---|
| Standard | 3.050 | 3.130 | 3.180 | 3.260 | 3.310 | 3.390 | 3.440 |
| Camarilla | 3.194 | 3.206 | 3.218 | 3.230 | 3.242 | 3.254 | 3.266 |
| Woodie | 3.035 | 3.123 | 3.165 | 3.253 | 3.295 | 3.383 | 3.425 |
| Fibonacci | 3.130 | 3.180 | 3.210 | 3.260 | 3.310 | 3.340 | 3.390 |
| Pivot points | S3 | S2 | S1 | PP | R1 | R2 | R3 |
|---|---|---|---|---|---|---|---|
| Standard | 2.908 | 3.032 | 3.128 | 3.252 | 3.348 | 3.472 | 3.568 |
| Camarilla | 3.165 | 3.185 | 3.205 | 3.225 | 3.245 | 3.265 | 3.286 |
| Woodie | 2.895 | 3.025 | 3.115 | 3.245 | 3.335 | 3.465 | 3.555 |
| Fibonacci | 3.032 | 3.116 | 3.168 | 3.252 | 3.336 | 3.388 | 3.472 |
Numerical data
The following is the status of the technical indicators and moving averages at the time of publication of this technical analysis:
| RSI (14): | 42.06 | |
| MACD (12,26,9): | -0.0440 | |
| Directional Movement: | -16.024 | |
| AROON (14): | -35.714 | |
| DEMA (21): | 3.079 | |
| Parabolic SAR (0,02-0,02-0,2): | 3.185 | |
| Elder Ray (13): | -0.004 | |
| Super Trend (3,10): | 3.156 | |
| Zig ZAG (10): | 3.100 | |
| VORTEX (21): | 0.8080 | |
| Stochastique (14,3,5): | 29.93 | |
| TEMA (21): | 3.056 | |
| Williams %R (14): | -63.27 | |
| Chande Momentum Oscillator (20): | -0.150 | |
| Repulse (5,40,3): | 0.4140 | |
| ROCnROLL: | 2 | |
| TRIX (15,9): | -0.1850 | |
| Courbe Coppock: | 9.73 |
| MA7: | 3.194 | |
| MA20: | 3.224 | |
| MA50: | 3.207 | |
| MA100: | 3.239 | |
| MAexp7: | 3.092 | |
| MAexp20: | 3.135 | |
| MAexp50: | 3.189 | |
| MAexp100: | 3.216 | |
| Price / MA7: | -3.10% | |
| Price / MA20: | -4.00% | |
| Price / MA50: | -3.49% | |
| Price / MA100: | -4.45% | |
| Price / MAexp7: | +0.10% | |
| Price / MAexp20: | -1.28% | |
| Price / MAexp50: | -2.95% | |
| Price / MAexp100: | -3.76% |
News
Don't forget to follow the news on BORUSSIA DORTMUND. At the time of publication of this analysis, the latest news was as follows:
- EQS-Adhoc: Borussia Dortmund reports preliminary figures for the first half (H1) of the 2024/2025 financial year
- Borussia Dortmund Reports Preliminary Figures for the First Half (H1) of the 2024/2025 Financial Year
- EQS-News: Niko Kovač becomes new head coach of Borussia Dortmund
- Niko Kovač Becomes New Head Coach of Borussia Dortmund
- EQS-News: Distribution key for revenues from centralized marketing for the 2025/26 to 2028/29 seasons adopted by the DFL
About author
Online


Add a comment
Comments
0 comments on the analysis BORUSSIA DORTMUND - 1H