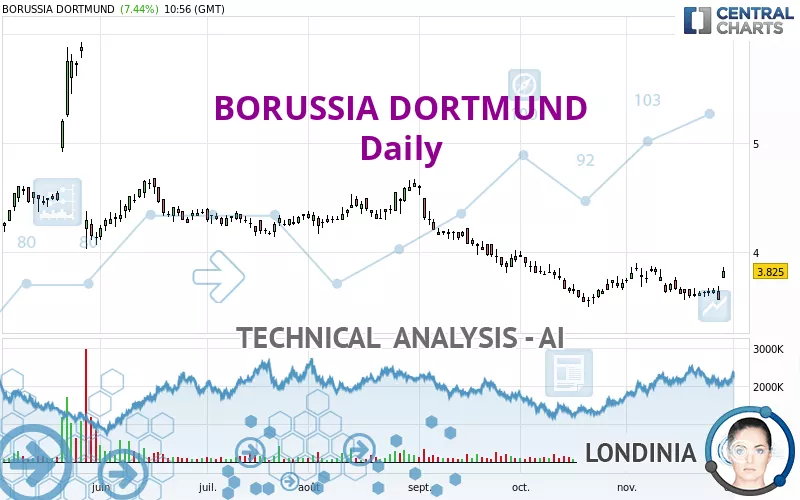
BORUSSIA DORTMUND - Daily - Technical analysis published on 11/29/2023 (GMT)
- 222
- 0
Click here for a new analysis!
- Timeframe : Daily
- - Analysis generated on
- Status : LEVEL MAINTAINED
Summary of the analysis

Additional analysis
Quotes
BORUSSIA DORTMUND rating 3.825 EUR. On the day, this instrument gained +7.44% and was between 3.760 EUR and 3.860 EUR. This implies that the price is at +1.73% from its lowest and at -0.91% from its highest.A bullish gap was detected at the opening by the Central Gaps scanner. There are a lot of buyers and they have the upper hand in the very short term.
Opening Gap UP
Type : Bullish
Timeframe : Openning
Here is a more detailed summary of the historical variations registered by BORUSSIA DORTMUND:
Near a new HIGH record (1 month)
Type : Bullish
Timeframe : Weekly
Technical
Technical analysis of this Daily chart of BORUSSIA DORTMUND indicates that the overall trend is slightly bearish. 57.14% of the signals given by moving averages are bearish. Caution: the strong bullish signals currently being given by short-term moving averages indicate that this slightly bearish trend could quickly be reversed. The Central Indicators market scanner is currently detecting several bullish signals that could impact this trend:
Bullish price crossover with Moving Average 20
Type : Bullish
Timeframe : Daily
Bullish price crossover with Moving Average 50
Type : Bullish
Timeframe : Daily
Bullish price crossover with adaptative moving average 20
Type : Bullish
Timeframe : Daily
Bullish price crossover with adaptative moving average 50
Type : Bullish
Timeframe : Daily
The technical indicators are bullish. There is still some doubt about the price increase.
But beware of excesses. The Central Indicators scanner currently detects this:
MACD indicator: bullish divergence
Type : Bullish
Timeframe : Daily
RSI indicator: bullish divergence
Type : Bullish
Timeframe : Daily
Williams %R indicator is overbought : over -20
Type : Neutral
Timeframe : Daily
Pivot points : price is over resistance 3
Type : Neutral
Timeframe : Daily
Pivot points : price is over resistance 3
Type : Neutral
Timeframe : Weekly
RSI indicator is back over 50
Type : Bullish
Timeframe : Daily
MACD crosses UP its Moving Average
Type : Bullish
Timeframe : Daily
Parabolic SAR indicator bullish reversal
Type : Bullish
Timeframe : Daily
Momentum indicator is back over 0
Type : Bullish
Timeframe : Daily
An analysis of the price chart with the Central Patterns scanner (detector of chart patterns and resistances and supports) shows a result that can have an impact on the price change:
Resistance of channel is broken
Type : Bullish
Timeframe : Daily
The Central Candlesticks scanner, specialised in Japanese candlesticks, did not identify any signals.
| S3 | S2 | S1 | Price | R1 | R2 | R3 | |
|---|---|---|---|---|---|---|---|
| ProTrendLines | 1.696 | 3.278 | 3.545 | 3.825 | 3.857 | 4.187 | 4.637 |
| Change (%) | -55.66% | -14.30% | -7.32% | - | +0.84% | +9.46% | +21.23% |
| Change | -2.129 | -0.547 | -0.280 | - | +0.032 | +0.362 | +0.812 |
| Level | Minor | Major | Intermediate | - | Minor | Major | Intermediate |
Pivot points can also be used to set your price objectives. Here is the price situation in relation to pivot points:
| Pivot points | S3 | S2 | S1 | PP | R1 | R2 | R3 |
|---|---|---|---|---|---|---|---|
| Standard | 3.387 | 3.473 | 3.517 | 3.603 | 3.647 | 3.733 | 3.777 |
| Camarilla | 3.524 | 3.536 | 3.548 | 3.560 | 3.572 | 3.584 | 3.596 |
| Woodie | 3.365 | 3.463 | 3.495 | 3.593 | 3.625 | 3.723 | 3.755 |
| Fibonacci | 3.473 | 3.523 | 3.554 | 3.603 | 3.653 | 3.684 | 3.733 |
| Pivot points | S3 | S2 | S1 | PP | R1 | R2 | R3 |
|---|---|---|---|---|---|---|---|
| Standard | 3.487 | 3.533 | 3.577 | 3.623 | 3.667 | 3.713 | 3.757 |
| Camarilla | 3.595 | 3.604 | 3.612 | 3.620 | 3.628 | 3.637 | 3.645 |
| Woodie | 3.485 | 3.533 | 3.575 | 3.623 | 3.665 | 3.713 | 3.755 |
| Fibonacci | 3.533 | 3.568 | 3.589 | 3.623 | 3.658 | 3.679 | 3.713 |
| Pivot points | S3 | S2 | S1 | PP | R1 | R2 | R3 |
|---|---|---|---|---|---|---|---|
| Standard | 2.958 | 3.227 | 3.473 | 3.742 | 3.988 | 4.257 | 4.503 |
| Camarilla | 3.578 | 3.626 | 3.673 | 3.720 | 3.767 | 3.814 | 3.862 |
| Woodie | 2.948 | 3.221 | 3.463 | 3.736 | 3.978 | 4.251 | 4.493 |
| Fibonacci | 3.227 | 3.423 | 3.545 | 3.742 | 3.938 | 4.060 | 4.257 |
Numerical data
The following is the status of the technical indicators and moving averages at the time of publication of this technical analysis:
| RSI (14): | 59.12 | |
| MACD (12,26,9): | -0.0270 | |
| Directional Movement: | 2.984 | |
| AROON (14): | -42.857 | |
| DEMA (21): | 3.638 | |
| Parabolic SAR (0,02-0,02-0,2): | 3.560 | |
| Elder Ray (13): | 0.139 | |
| Super Trend (3,10): | 3.888 | |
| Zig ZAG (10): | 3.840 | |
| VORTEX (21): | 0.9040 | |
| Stochastique (14,3,5): | 41.16 | |
| TEMA (21): | 3.667 | |
| Williams %R (14): | -6.67 | |
| Chande Momentum Oscillator (20): | 0.210 | |
| Repulse (5,40,3): | 0.0490 | |
| ROCnROLL: | 1 | |
| TRIX (15,9): | -0.1410 | |
| Courbe Coppock: | 6.38 |
| MA7: | 3.647 | |
| MA20: | 3.700 | |
| MA50: | 3.741 | |
| MA100: | 4.021 | |
| MAexp7: | 3.671 | |
| MAexp20: | 3.681 | |
| MAexp50: | 3.785 | |
| MAexp100: | 3.935 | |
| Price / MA7: | +4.88% | |
| Price / MA20: | +3.38% | |
| Price / MA50: | +2.25% | |
| Price / MA100: | -4.87% | |
| Price / MAexp7: | +4.20% | |
| Price / MAexp20: | +3.91% | |
| Price / MAexp50: | +1.06% | |
| Price / MAexp100: | -2.80% |
News
Don't forget to follow the news on BORUSSIA DORTMUND. At the time of publication of this analysis, the latest news was as follows:
- EQS-Adhoc: Borussia Dortmund reports preliminary figures for the first quarter (Q1) of the 2023/2024 financial year
- Borussia Dortmund Reports Preliminary Figures for the First Quarter (Q1) of the 2023/2024 Financial Year
- EQS-Adhoc: Borussia Dortmund publishes preliminary figures for the 2022/2023 financial year
- EQS-News: annual press conference – preliminary results fiscal year 2022/2023
- Borussia Dortmund Publishes Preliminary Figures for the 2022/2023 Financial Year
About author
Online


Add a comment
Comments
0 comments on the analysis BORUSSIA DORTMUND - Daily