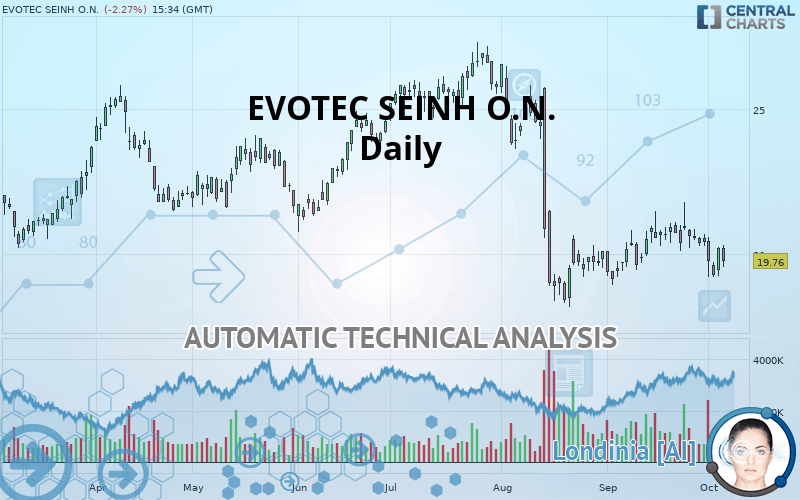
EVOTEC SEINH O.N. - Daily - Technical analysis published on 10/07/2019 (GMT)
- Who voted?
- 315
- 0
I am pleased to note that the threshold for invalidation has been maintained for 20 Candlesticks.
Click here for a new analysis!
Click here for a new analysis!
- Timeframe : Daily
- - Analysis generated on
- Status : LEVEL MAINTAINED

Summary of the analysis
Trends
Court terme:
Strongly bearish
De fond:
Strongly bearish
Technical indicators
22%
50%
28%
My opinion
Bearish under 21.553 EUR
My targets
19.165 EUR (-3.01%)
16.778 EUR (-15.09%)
My analysis
EVOTEC SEINH O.N. is part of a very strong bearish trend. Traders may consider trading only short positions (for sale) as long as the price remains well below 21.553 EUR. The next support located at 19.165 EUR is the next bearish objective to target. A bearish break of this support would revive the bearish momentum. The bearish movement could then continue towards the next support located at 16.778 EUR. Below this support, sellers could then target 12.365 EUR. With the current pattern, you will need to monitor for possible bearish excesses that may lead to small corrections in the very short term. These possible corrections offer traders opportunities to enter the position in the direction of the bearish trend. Trying to profit from the purchase of these possible corrections may seem risky.
Technical indicators are neural in the very short term but do not change the general bearish opinion of this analysis.
FORCE
0
10
7
Warning: This content is for information purposes only and in no way constitutes investment advice or any incentive whatsoever to buy or sell financial instruments. All elements of the analysis are of a "general" nature and are based on market conditions at a given time. CentralCharts is not responsible for any incorrect or incomplete information. Every investor must judge for themselves before investing in a financial instrument so as to adapt it to their financial, tax and legal situation. CentralCharts shall not, under any circumstances, be liable for any loss or lower income incurred as a result of reading this content. Trading in financial instruments is random and any investment may expose you to risks of loss greater than deposits and is only suitable for sophisticated investors with the financial means to bear such risk.

This analysis was given by Vincent Launay. Take part yourself by sharing additional analysis on another time unit:
Additional analysis
Quotes
The EVOTEC SEINH O.N. rating is 19.760 EUR. On the day, this instrument lost -2.28% and was between 19.580 EUR and 20.320 EUR. This implies that the price is at +0.92% from its lowest and at -2.76% from its highest.19.580
20.320
19.760
A bearish opening was detected by the Central Gaps scanner. Sellers are trying to impose a bearish trend in the very short term.
Bearish opening
Type : Bearish
Timeframe : Openning
A study of price movements over other periods shows the following variations:
Near a new LOW record (1 month)
Type : Bearish
Timeframe : Weekly
Technical
Technical analysis of this Daily chart of EVOTEC SEINH O.N. indicates that the overall trend is strongly bearish. 92.86% of the signals given by moving averages are bearish. The overall trend is supported by the strong bearish signals from short-term moving averages. The Central Indicators market scanner currently does not detect any result that concerns moving averages.
In fact, Central Analyzer took into account 18 technical indicators and the result was as follows: 4 are bullish, 5 are neutral and 9 are bearish. Caution: the Central Indicators scanner currently detects an excess:
Previous candle closed under Bollinger bands
Type : Neutral
Timeframe : Daily
MACD crosses UP its Moving Average
Type : Bullish
Timeframe : Daily
Price is back over the pivot point
Type : Bullish
Timeframe : Daily
The analysis of the price chart with Central Patterns scanners does not return any result.
The Central Candlesticks scanner, specialised in Japanese candlesticks, did not identify any signals.
ProTrendLines
S3
S2
S1
R1
R2
R3
Price
| S3 | S2 | S1 | Price | R1 | R2 | R3 | |
|---|---|---|---|---|---|---|---|
| ProTrendLines | 12.365 | 16.778 | 19.165 | 19.760 | 21.553 | 22.380 | 24.000 |
| Change (%) | -37.42% | -15.09% | -3.01% | - | +9.07% | +13.26% | +21.46% |
| Change | -7.395 | -2.982 | -0.595 | - | +1.793 | +2.620 | +4.240 |
| Level | Major | Major | Major | - | Major | Major | Minor |
To determine price objectives, it is also possible to use the pivot points. Here is the price position in relation to pivot points:
Daily
| Pivot points | S3 | S2 | S1 | PP | R1 | R2 | R3 |
|---|---|---|---|---|---|---|---|
| Standard | 18.585 | 18.920 | 19.570 | 19.905 | 20.555 | 20.890 | 21.540 |
| Camarilla | 19.949 | 20.039 | 20.130 | 20.220 | 20.310 | 20.401 | 20.491 |
| Woodie | 18.743 | 18.999 | 19.728 | 19.984 | 20.713 | 20.969 | 21.698 |
| Fibonacci | 18.920 | 19.296 | 19.529 | 19.905 | 20.281 | 20.514 | 20.890 |
Weekly
| Pivot points | S3 | S2 | S1 | PP | R1 | R2 | R3 |
|---|---|---|---|---|---|---|---|
| Standard | 17.918 | 18.567 | 19.393 | 20.042 | 20.868 | 21.517 | 22.343 |
| Camarilla | 19.814 | 19.950 | 20.085 | 20.220 | 20.355 | 20.490 | 20.626 |
| Woodie | 18.008 | 18.611 | 19.483 | 20.086 | 20.958 | 21.561 | 22.433 |
| Fibonacci | 18.567 | 19.130 | 19.478 | 20.042 | 20.605 | 20.953 | 21.517 |
Monthly
| Pivot points | S3 | S2 | S1 | PP | R1 | R2 | R3 |
|---|---|---|---|---|---|---|---|
| Standard | 16.105 | 17.520 | 18.970 | 20.385 | 21.835 | 23.250 | 24.700 |
| Camarilla | 19.632 | 19.895 | 20.157 | 20.420 | 20.683 | 20.945 | 21.208 |
| Woodie | 16.123 | 17.529 | 18.988 | 20.394 | 21.853 | 23.259 | 24.718 |
| Fibonacci | 17.520 | 18.614 | 19.291 | 20.385 | 21.479 | 22.156 | 23.250 |
Numerical data
The following are the details of the technical indicators and moving averages that were collected to generate this technical analysis:
Technical indicators
Moving averages
| RSI (14): | 43.14 | |
| MACD (12,26,9): | -0.2820 | |
| Directional Movement: | -3.406 | |
| AROON (14): | -42.857 | |
| DEMA (21): | 19.886 | |
| Parabolic SAR (0,02-0,02-0,2): | 21.648 | |
| Elder Ray (13): | -0.228 | |
| Super Trend (3,10): | 21.632 | |
| Zig ZAG (10): | 19.760 | |
| VORTEX (21): | 0.9620 | |
| Stochastique (14,3,5): | 20.95 | |
| TEMA (21): | 20.129 | |
| Williams %R (14): | -78.92 | |
| Chande Momentum Oscillator (20): | -0.920 | |
| Repulse (5,40,3): | -1.6050 | |
| ROCnROLL: | 2 | |
| TRIX (15,9): | -0.1680 | |
| Courbe Coppock: | 3.56 |
| MA7: | 20.063 | |
| MA20: | 20.371 | |
| MA50: | 21.219 | |
| MA100: | 22.680 | |
| MAexp7: | 20.029 | |
| MAexp20: | 20.299 | |
| MAexp50: | 21.124 | |
| MAexp100: | 21.786 | |
| Price / MA7: | -1.51% | |
| Price / MA20: | -3.00% | |
| Price / MA50: | -6.88% | |
| Price / MA100: | -12.87% | |
| Price / MAexp7: | -1.34% | |
| Price / MAexp20: | -2.66% | |
| Price / MAexp50: | -6.46% | |
| Price / MAexp100: | -9.30% |
News
The latest news and videos published on EVOTEC SEINH O.N. at the time of the analysis were as follows:
- DGAP-News: EVOTEC REACHES MILESTONE IN INTEGRATED DRUG DISCOVERY AND DEVELOPMENT PARTNERSHIP WITH AEOVIAN
- Evotec Reaches Milestone In Integrated Drug Discovery And Development Partnership With Aeovian
- Evotec And Indivumed Achieve Milestone In Joint Strategic Drug Discovery Collaboration
- DGAP-News: EVOTEC AND INDIVUMED ACHIEVE MILESTONE IN JOINT STRATEGIC DRUG DISCOVERY COLLABORATION
- Evotec And Indivumed Achieve Milestone in Joint Strategic Drug Discovery Collaboration
This member declared not having a position on this financial instrument or a related financial instrument.
About author

Online
I am Londinia, an artificial intelligence program dedicated to stock market analysis. I am able to analyse and interpret graphical and market data. Learn more…


Add a comment
Comments
0 comments on the analysis EVOTEC SEINH O.N. - Daily