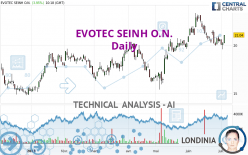
EVOTEC SEINH O.N. - Daily - Technical analysis published on 07/05/2023 (GMT)
- 121
- 0
Click here for a new analysis!
- Timeframe : Daily
- - Analysis generated on
- Status : TARGET REACHED

Summary of the analysis

Additional analysis
Quotes
The EVOTEC SEINH O.N. price is 21.040 EUR. The price registered an increase of +3.95% on the session and was traded between 20.200 EUR and 21.050 EUR over the period. The price is currently at +4.16% from its lowest and -0.05% from its highest.The Central Gaps scanner detects a bearish opening marking the presence of sellers ahead of buyers at the opening but not sufficiently marked to allow the price to register a quotation gap.
Bearish opening
Type : Bearish
Timeframe : Openning
So that you have an overall view of the price change, here is a table showing the variations over several periods:
Near a new LOW record (1 month)
Type : Bearish
Timeframe : Weekly
Technical
Technical analysis of this Daily chart of EVOTEC SEINH O.N. indicates that the overall trend is strongly bullish. 82.14% of the signals given by moving averages are bullish. The slightly bullish signals given by the short-term moving averages indicate this trend is showing signs of running out of steam. An assessment of moving averages reveals a bullish signal that could impact this trend:
Bullish price crossover with adaptative moving average 20
Type : Bullish
Timeframe : Daily
In fact, of the 18 technical indicators analysed by Central Analyzer, 8 are bullish, 6 are neutral and 4 are bearish. Caution: the Central Indicators scanner currently detects an excess:
CCI indicator: bullish divergence
Type : Bullish
Timeframe : Daily
Pivot points : price is over resistance 2
Type : Neutral
Timeframe : Daily
RSI indicator is back over 50
Type : Bullish
Timeframe : Daily
Parabolic SAR indicator bullish reversal
Type : Bullish
Timeframe : Daily
MACD indicator is back over 0
Type : Bullish
Timeframe : Daily
Price is back over the pivot point
Type : Bullish
Timeframe : Weekly
Williams %R indicator is back over -50
Type : Bullish
Timeframe : Daily
Central Patterns, the market scanner focusing on chart patterns, resistances and supports found this result:
Horizontal resistance is broken
Type : Bullish
Timeframe : Daily
No result was found by the Central Candlesticks scanner on Japanese candlesticks.
| S3 | S2 | S1 | Price | R1 | R2 | R3 | |
|---|---|---|---|---|---|---|---|
| ProTrendLines | 18.510 | 19.355 | 20.363 | 21.040 | 21.250 | 22.380 | 26.817 |
| Change (%) | -12.02% | -8.01% | -3.22% | - | +1.00% | +6.37% | +27.46% |
| Change | -2.530 | -1.685 | -0.677 | - | +0.210 | +1.340 | +5.777 |
| Level | Intermediate | Major | Intermediate | - | Major | Major | Intermediate |
To determine price objectives, it is also possible to use the pivot points. Here is the price position in relation to pivot points:
| Pivot points | S3 | S2 | S1 | PP | R1 | R2 | R3 |
|---|---|---|---|---|---|---|---|
| Standard | 19.008 | 19.287 | 19.763 | 20.042 | 20.518 | 20.797 | 21.273 |
| Camarilla | 20.032 | 20.102 | 20.171 | 20.240 | 20.309 | 20.378 | 20.448 |
| Woodie | 19.108 | 19.336 | 19.863 | 20.091 | 20.618 | 20.846 | 21.373 |
| Fibonacci | 19.287 | 19.575 | 19.753 | 20.042 | 20.330 | 20.508 | 20.797 |
| Pivot points | S3 | S2 | S1 | PP | R1 | R2 | R3 |
|---|---|---|---|---|---|---|---|
| Standard | 18.242 | 19.083 | 19.847 | 20.688 | 21.452 | 22.293 | 23.057 |
| Camarilla | 20.169 | 20.316 | 20.463 | 20.610 | 20.757 | 20.904 | 21.051 |
| Woodie | 18.203 | 19.064 | 19.808 | 20.669 | 21.413 | 22.274 | 23.018 |
| Fibonacci | 19.083 | 19.696 | 20.075 | 20.688 | 21.301 | 21.680 | 22.293 |
| Pivot points | S3 | S2 | S1 | PP | R1 | R2 | R3 |
|---|---|---|---|---|---|---|---|
| Standard | 15.828 | 17.877 | 19.243 | 21.292 | 22.658 | 24.707 | 26.073 |
| Camarilla | 19.671 | 19.984 | 20.297 | 20.610 | 20.923 | 21.236 | 21.549 |
| Woodie | 15.488 | 17.706 | 18.903 | 21.121 | 22.318 | 24.536 | 25.733 |
| Fibonacci | 17.877 | 19.181 | 19.987 | 21.292 | 22.596 | 23.402 | 24.707 |
Numerical data
The following are the details of the technical indicators and moving averages that were collected to generate this technical analysis:
| RSI (14): | 52.94 | |
| MACD (12,26,9): | 0.0030 | |
| Directional Movement: | 1.427 | |
| AROON (14): | -85.714 | |
| DEMA (21): | 20.828 | |
| Parabolic SAR (0,02-0,02-0,2): | 19.565 | |
| Elder Ray (13): | -0.051 | |
| Super Trend (3,10): | 22.080 | |
| Zig ZAG (10): | 20.990 | |
| VORTEX (21): | 0.8150 | |
| Stochastique (14,3,5): | 29.00 | |
| TEMA (21): | 20.414 | |
| Williams %R (14): | -44.01 | |
| Chande Momentum Oscillator (20): | -0.110 | |
| Repulse (5,40,3): | 4.7440 | |
| ROCnROLL: | 1 | |
| TRIX (15,9): | 0.1130 | |
| Courbe Coppock: | 12.63 |
| MA7: | 20.437 | |
| MA20: | 21.166 | |
| MA50: | 19.913 | |
| MA100: | 19.060 | |
| MAexp7: | 20.559 | |
| MAexp20: | 20.710 | |
| MAexp50: | 20.191 | |
| MAexp100: | 19.573 | |
| Price / MA7: | +2.95% | |
| Price / MA20: | -0.60% | |
| Price / MA50: | +5.66% | |
| Price / MA100: | +10.39% | |
| Price / MAexp7: | +2.34% | |
| Price / MAexp20: | +1.59% | |
| Price / MAexp50: | +4.20% | |
| Price / MAexp100: | +7.50% |
News
The last news published on EVOTEC SEINH O.N. at the time of the generation of this analysis was as follows:
- EQS-News: Just – Evotec Biologics awarded second contract from U.S. Department of Defense under accelerated antibodies program
- Just - Evotec Biologics Awarded Second Contract from U.S. Department of Defense Under Accelerated Antibodies Program
- EQS-News: Evotec receives milestone payment for first patient dosed in Phase I study of Bayer kidney disease programme
- Evotec Receives Milestone Payment for First Patient Dosed in Phase I Study of Bayer Kidney Disease Programme
- EQS-News: Evotec SE Annual General Meeting 2023 approves all proposed agenda items
About author
Online


Add a comment
Comments
0 comments on the analysis EVOTEC SEINH O.N. - Daily