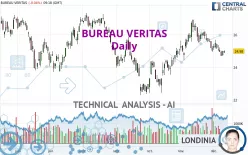
BUREAU VERITAS - Daily - Technical analysis published on 12/12/2022 (GMT)
- 242
- 0
Click here for a new analysis!
- Timeframe : Daily
- - Analysis generated on
- Status : LEVEL MAINTAINED

Summary of the analysis

Additional analysis
Quotes
The BUREAU VERITAS rating is 24.98 EUR. The price is lower by -0.04% since the last closing and was traded between 24.88 EUR and 25.04 EUR over the period. The price is currently at +0.40% from its lowest and -0.24% from its highest.The Central Gaps scanner detects a bearish opening. A small advantage for sellers in the very short term.
Bearish opening
Type : Bearish
Timeframe : Openning
A study of price movements over other periods shows the following variations:
Near a new LOW record (1 month)
Type : Bearish
Timeframe : Weekly
Technical
Technical analysis of this Daily chart of BUREAU VERITAS indicates that the overall trend is slightly bearish. Only 60.71% of the signals given by moving averages are bearish. This slightly bearish trend is not supported by the signals currently being given by short-term moving averages. The Central Indicators market scanner is currently detecting a bearish signal that could impact this trend:
Bearish price crossover with Moving Average 50
Type : Bearish
Timeframe : Daily
The technical indicators are generally neutral. They do not provide relevant information on the direction of future price movements.
But beware of excesses. The Central Indicators scanner currently detects this:
Williams %R indicator is oversold : under -80
Type : Neutral
Timeframe : Daily
Price is back over the pivot point
Type : Bullish
Timeframe : Daily
The Central Patterns scanner, which studies chart patterns, resistances and supports, has identified this signal:
Near horizontal support
Type : Bullish
Timeframe : Daily
The Central Candlesticks scanner, specialised in Japanese candlesticks, did not identify any signals.
| S3 | S2 | S1 | Price | R1 | R2 | R3 | |
|---|---|---|---|---|---|---|---|
| ProTrendLines | 22.96 | 23.44 | 24.86 | 24.98 | 25.65 | 26.25 | 27.05 |
| Change (%) | -8.09% | -6.16% | -0.48% | - | +2.68% | +5.08% | +8.29% |
| Change | -2.02 | -1.54 | -0.12 | - | +0.67 | +1.27 | +2.07 |
| Level | Minor | Intermediate | Major | - | Intermediate | Intermediate | Major |
Attention could also be paid to pivot points to set price objectives:
| Pivot points | S3 | S2 | S1 | PP | R1 | R2 | R3 |
|---|---|---|---|---|---|---|---|
| Standard | 24.50 | 24.60 | 24.80 | 24.90 | 25.10 | 25.20 | 25.40 |
| Camarilla | 24.91 | 24.94 | 24.96 | 24.99 | 25.02 | 25.05 | 25.07 |
| Woodie | 24.54 | 24.63 | 24.84 | 24.93 | 25.14 | 25.23 | 25.44 |
| Fibonacci | 24.60 | 24.72 | 24.79 | 24.90 | 25.02 | 25.09 | 25.20 |
| Pivot points | S3 | S2 | S1 | PP | R1 | R2 | R3 |
|---|---|---|---|---|---|---|---|
| Standard | 23.88 | 24.29 | 24.64 | 25.05 | 25.40 | 25.81 | 26.16 |
| Camarilla | 24.78 | 24.85 | 24.92 | 24.99 | 25.06 | 25.13 | 25.20 |
| Woodie | 23.85 | 24.28 | 24.61 | 25.04 | 25.37 | 25.80 | 26.13 |
| Fibonacci | 24.29 | 24.58 | 24.76 | 25.05 | 25.34 | 25.52 | 25.81 |
| Pivot points | S3 | S2 | S1 | PP | R1 | R2 | R3 |
|---|---|---|---|---|---|---|---|
| Standard | 21.49 | 22.96 | 23.99 | 25.46 | 26.49 | 27.96 | 28.99 |
| Camarilla | 24.33 | 24.56 | 24.79 | 25.02 | 25.25 | 25.48 | 25.71 |
| Woodie | 21.27 | 22.85 | 23.77 | 25.35 | 26.27 | 27.85 | 28.77 |
| Fibonacci | 22.96 | 23.92 | 24.51 | 25.46 | 26.42 | 27.01 | 27.96 |
Numerical data
The following are the details of the technical indicators and moving averages that were collected to generate this technical analysis:
| RSI (14): | 44.55 | |
| MACD (12,26,9): | -0.1000 | |
| Directional Movement: | -5.57 | |
| AROON (14): | -78.57 | |
| DEMA (21): | 25.24 | |
| Parabolic SAR (0,02-0,02-0,2): | 25.63 | |
| Elder Ray (13): | -0.24 | |
| Super Trend (3,10): | 24.67 | |
| Zig ZAG (10): | 24.98 | |
| VORTEX (21): | 0.8200 | |
| Stochastique (14,3,5): | 12.53 | |
| TEMA (21): | 24.94 | |
| Williams %R (14): | -81.88 | |
| Chande Momentum Oscillator (20): | -0.71 | |
| Repulse (5,40,3): | 0.1300 | |
| ROCnROLL: | 2 | |
| TRIX (15,9): | 0.0300 | |
| Courbe Coppock: | 7.39 |
| MA7: | 25.05 | |
| MA20: | 25.49 | |
| MA50: | 24.98 | |
| MA100: | 25.15 | |
| MAexp7: | 25.04 | |
| MAexp20: | 25.28 | |
| MAexp50: | 25.16 | |
| MAexp100: | 25.11 | |
| Price / MA7: | -0.28% | |
| Price / MA20: | -2.00% | |
| Price / MA50: | -0% | |
| Price / MA100: | -0.68% | |
| Price / MAexp7: | -0.24% | |
| Price / MAexp20: | -1.19% | |
| Price / MAexp50: | -0.72% | |
| Price / MAexp100: | -0.52% |
News
The last news published on BUREAU VERITAS at the time of the generation of this analysis was as follows:
- BUREAU VERITAS Number of shares and voting rights as of 30 November 2022
- BUREAU VERITAS Number of shares and voting rights as of October 31 2022
- Bureau Veritas: strong organic revenue growth in the third quarter of 2022; 2022 Full Year outlook confirmed
- Bureau Veritas: acquisition of Galbraith Laboratories Inc., a US expert in Healthcare analytical testing solutions
- Bureau Veritas: acquires a majority stake in C.A.P Government, Inc., expanding its Buildings & Infrastructure footprint in the US
About author
Online


Add a comment
Comments
0 comments on the analysis BUREAU VERITAS - Daily