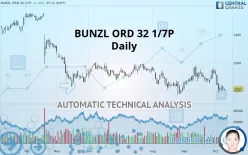
BUNZL ORD 32 1/7P - Daily - Technical analysis published on 10/09/2019 (GMT)
- 570
- 0
- Who voted?
Click here for a new analysis!
- Timeframe : Daily
- - Analysis generated on
- Status : TARGET REACHED

Summary of the analysis

Additional analysis
Quotes
The BUNZL ORD 32 1/7P rating is 2,011.0 GBX. The price registered an increase of +0.10% on the session with the lowest point at 2,003.0 GBX and the highest point at 2,012.0 GBX. The deviation from the price is +0.40% for the low point and -0.05% for the high point.The Central Gaps scanner detects a bullish opening marking the presence of buyers ahead of sellers at the opening but not sufficiently marked to allow the price to register a quotation gap.
Bullish opening
Type : Bullish
Timeframe : Openning
So that you have an overall view of the price change, here is a table showing the variations over several periods:
Near a new LOW record (1 year)
Type : Bearish
Timeframe : Weekly
Near a new LOW record (1st january)
Type : Bearish
Timeframe : Weekly
Near a new LOW record (1 month)
Type : Bearish
Timeframe : Weekly
Technical
Technical analysis of this Daily chart of BUNZL ORD 32 1/7P indicates that the overall trend is strongly bearish. 89.29% of the signals given by moving averages are bearish. This strongly bearish trend is supported by the strong bearish signals given by short-term moving averages. The Central Indicators scanner does not detect any result on moving averages that would impact this trend.
In fact, only 9 technical indicators out of 18 studied are currently positioned bearish. But beware of excesses. The Central Indicators scanner currently detects this:
CCI indicator is oversold : under -100
Type : Neutral
Timeframe : Daily
Williams %R indicator is oversold : under -80
Type : Neutral
Timeframe : Daily
Price is back under the pivot point
Type : Bearish
Timeframe : Weekly
An analysis of the price chart with the Central Patterns scanner (detector of chart patterns and resistances and supports) shows a result that can have an impact on the price change:
Support of channel is broken
Type : Bearish
Timeframe : Daily
The Central Candlesticks scanner which studies Japanese candlesticks did not detect anything.
| S3 | S2 | S1 | Price | R1 | R2 | R3 | |
|---|---|---|---|---|---|---|---|
| ProTrendLines | 725.8 | 1,674.8 | 1,940.7 | 2,011.0 | 2,060.9 | 2,185.0 | 2,346.2 |
| Change (%) | -63.91% | -16.72% | -3.50% | - | +2.48% | +8.65% | +16.67% |
| Change | -1,285.2 | -336.2 | -70.3 | - | +49.9 | +174.0 | +335.2 |
| Level | Minor | Intermediate | Major | - | Major | Major | Minor |
Attention could also be paid to pivot points to set price objectives:
| Pivot points | S3 | S2 | S1 | PP | R1 | R2 | R3 |
|---|---|---|---|---|---|---|---|
| Standard | 1,959.0 | 1,979.0 | 1,999.0 | 2,019.0 | 2,039.0 | 2,059.0 | 2,079.0 |
| Camarilla | 2,008.0 | 2,011.7 | 2,015.3 | 2,019.0 | 2,022.7 | 2,026.3 | 2,030.0 |
| Woodie | 1,959.0 | 1,979.0 | 1,999.0 | 2,019.0 | 2,039.0 | 2,059.0 | 2,079.0 |
| Fibonacci | 1,984.3 | 1,995.4 | 2,002.3 | 2,013.3 | 2,024.4 | 2,031.3 | 2,042.3 |
| Pivot points | S3 | S2 | S1 | PP | R1 | R2 | R3 |
|---|---|---|---|---|---|---|---|
| Standard | 1,765.3 | 1,873.7 | 1,943.3 | 2,051.7 | 2,121.3 | 2,229.7 | 2,299.3 |
| Camarilla | 1,964.1 | 1,980.4 | 1,996.7 | 2,013.0 | 2,029.3 | 2,045.6 | 2,062.0 |
| Woodie | 1,746.0 | 1,864.0 | 1,924.0 | 2,042.0 | 2,102.0 | 2,220.0 | 2,280.0 |
| Fibonacci | 1,873.7 | 1,941.7 | 1,983.7 | 2,051.7 | 2,119.7 | 2,161.7 | 2,229.7 |
| Pivot points | S3 | S2 | S1 | PP | R1 | R2 | R3 |
|---|---|---|---|---|---|---|---|
| Standard | 1,862.7 | 1,936.3 | 2,030.7 | 2,104.3 | 2,198.7 | 2,272.3 | 2,366.7 |
| Camarilla | 2,078.8 | 2,094.2 | 2,109.6 | 2,125.0 | 2,140.4 | 2,155.8 | 2,171.2 |
| Woodie | 1,873.0 | 1,941.5 | 2,041.0 | 2,109.5 | 2,209.0 | 2,277.5 | 2,377.0 |
| Fibonacci | 1,936.3 | 2,000.5 | 2,040.2 | 2,104.3 | 2,168.5 | 2,208.2 | 2,272.3 |
Numerical data
The following is the status of the technical indicators and moving averages at the time of publication of this technical analysis:
| RSI (14): | 38.50 | |
| MACD (12,26,9): | -15.3000 | |
| Directional Movement: | -9.7 | |
| AROON (14): | -21.5 | |
| DEMA (21): | 2,050.8 | |
| Parabolic SAR (0,02-0,02-0,2): | 2,137.4 | |
| Elder Ray (13): | -41.1 | |
| Super Trend (3,10): | 2,144.0 | |
| Zig ZAG (10): | 2,003.0 | |
| VORTEX (21): | 0.9000 | |
| Stochastique (14,3,5): | 15.90 | |
| TEMA (21): | 2,026.4 | |
| Williams %R (14): | -88.20 | |
| Chande Momentum Oscillator (20): | -69.0 | |
| Repulse (5,40,3): | -1.5000 | |
| ROCnROLL: | 2 | |
| TRIX (15,9): | 0.0000 | |
| Courbe Coppock: | 6.70 |
| MA7: | 2,031.3 | |
| MA20: | 2,085.7 | |
| MA50: | 2,074.7 | |
| MA100: | 2,103.6 | |
| MAexp7: | 2,030.5 | |
| MAexp20: | 2,065.7 | |
| MAexp50: | 2,083.7 | |
| MAexp100: | 2,121.9 | |
| Price / MA7: | -1.00% | |
| Price / MA20: | -3.58% | |
| Price / MA50: | -3.07% | |
| Price / MA100: | -4.40% | |
| Price / MAexp7: | -0.96% | |
| Price / MAexp20: | -2.65% | |
| Price / MAexp50: | -3.49% | |
| Price / MAexp100: | -5.23% |
About author

Online


Add a comment
Comments
0 comments on the analysis BUNZL ORD 32 1/7P - Daily