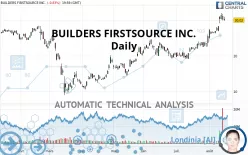
BUILDERS FIRSTSOURCE INC. - Daily - Technical analysis published on 08/18/2020 (GMT)
- 315
- 0
- Who voted?
Click here for a new analysis!
- Timeframe : Daily
- - Analysis generated on
- Status : INVALID

Summary of the analysis

Additional analysis
Quotes
BUILDERS FIRSTSOURCE INC. rating 30.02 USD. The price is lower by -0.83% since the last closing and was traded between 29.82 USD and 30.92 USD over the period. The price is currently at +0.67% from its lowest and -2.91% from its highest.The Central Gaps scanner detects a bullish opening marking the presence of buyers ahead of sellers at the opening but not sufficiently marked to allow the price to register a quotation gap.
Bullish opening
Type : Bullish
Timeframe : Openning
A study of price movements over other periods shows the following variations:
Near a new HIGH record (5 years)
Type : Bullish
Timeframe : Weekly
Near a new HIGH record (1 year)
Type : Bullish
Timeframe : Weekly
Near a new HIGH record (1st january)
Type : Bullish
Timeframe : Weekly
Near a new HIGH record (1 month)
Type : Bullish
Timeframe : Weekly
The Central Volumes scanner notes the presence of abnormal volumes:
Abnormal volumes
Timeframe : 5 days
Abnormal volumes
Timeframe : 20 days
Technical
Technical analysis of BUILDERS FIRSTSOURCE INC. in Daily shows a strongly overall bullish trend. The signals given by the moving averages are 92.86% bullish. This strong bullish trend is confirmed by the strong signals currently being given by short-term moving averages. The Central Indicators scanner does not detect any result on moving averages that would impact this trend.
In fact, 14 technical indicators on 18 studied are currently bullish. Caution: the Central Indicators scanner currently detects an excess:
RSI indicator is overbought : over 70
Type : Neutral
Timeframe : Daily
CCI indicator is overbought : over 100
Type : Neutral
Timeframe : Daily
Previous candle closed over Bollinger bands
Type : Neutral
Timeframe : Daily
Williams %R indicator is overbought : over -20
Type : Neutral
Timeframe : Daily
Price is back over the pivot point
Type : Bullish
Timeframe : Weekly
Price is back under the pivot point
Type : Bearish
Timeframe : Daily
The analysis of the price chart with Central Patterns scanners does not return any result.
The Central Candlesticks scanner, specialised in Japanese candlesticks, did not identify any signals.
| S3 | S2 | S1 | Price | |
|---|---|---|---|---|
| ProTrendLines | 23.03 | 25.80 | 28.18 | 30.02 |
| Change (%) | -23.28% | -14.06% | -6.13% | - |
| Change | -6.99 | -4.22 | -1.84 | - |
| Level | Major | Minor | Major | - |
Attention could also be paid to pivot points to set price objectives:
| Pivot points | S3 | S2 | S1 | PP | R1 | R2 | R3 |
|---|---|---|---|---|---|---|---|
| Standard | 27.78 | 28.84 | 29.56 | 30.62 | 31.34 | 32.40 | 33.12 |
| Camarilla | 29.78 | 29.94 | 30.11 | 30.27 | 30.43 | 30.60 | 30.76 |
| Woodie | 27.60 | 28.76 | 29.38 | 30.54 | 31.16 | 32.31 | 32.94 |
| Fibonacci | 28.84 | 29.52 | 29.94 | 30.62 | 31.30 | 31.72 | 32.40 |
| Pivot points | S3 | S2 | S1 | PP | R1 | R2 | R3 |
|---|---|---|---|---|---|---|---|
| Standard | 22.26 | 24.54 | 27.41 | 29.69 | 32.56 | 34.84 | 37.71 |
| Camarilla | 28.85 | 29.33 | 29.80 | 30.27 | 30.74 | 31.21 | 31.69 |
| Woodie | 22.55 | 24.69 | 27.70 | 29.84 | 32.85 | 34.99 | 38.00 |
| Fibonacci | 24.54 | 26.51 | 27.73 | 29.69 | 31.66 | 32.88 | 34.84 |
| Pivot points | S3 | S2 | S1 | PP | R1 | R2 | R3 |
|---|---|---|---|---|---|---|---|
| Standard | 12.98 | 16.05 | 19.87 | 22.93 | 26.76 | 29.82 | 33.64 |
| Camarilla | 21.80 | 22.43 | 23.06 | 23.69 | 24.32 | 24.95 | 25.58 |
| Woodie | 13.36 | 16.24 | 20.25 | 23.12 | 27.13 | 30.01 | 34.02 |
| Fibonacci | 16.05 | 18.68 | 20.30 | 22.93 | 25.56 | 27.19 | 29.82 |
Numerical data
The following are the details of the technical indicators and moving averages that were collected to generate this technical analysis:
| RSI (14): | 68.68 | |
| MACD (12,26,9): | 2.2300 | |
| Directional Movement: | 28.71 | |
| AROON (14): | 85.71 | |
| DEMA (21): | 29.30 | |
| Parabolic SAR (0,02-0,02-0,2): | 28.68 | |
| Elder Ray (13): | 2.56 | |
| Super Trend (3,10): | 26.25 | |
| Zig ZAG (10): | 30.02 | |
| VORTEX (21): | 1.1200 | |
| Stochastique (14,3,5): | 84.97 | |
| TEMA (21): | 30.48 | |
| Williams %R (14): | -20.72 | |
| Chande Momentum Oscillator (20): | 6.59 | |
| Repulse (5,40,3): | -3.9300 | |
| ROCnROLL: | 1 | |
| TRIX (15,9): | 1.1100 | |
| Courbe Coppock: | 52.39 |
| MA7: | 29.11 | |
| MA20: | 25.97 | |
| MA50: | 23.11 | |
| MA100: | 19.79 | |
| MAexp7: | 29.19 | |
| MAexp20: | 26.58 | |
| MAexp50: | 23.76 | |
| MAexp100: | 22.09 | |
| Price / MA7: | +3.13% | |
| Price / MA20: | +15.59% | |
| Price / MA50: | +29.90% | |
| Price / MA100: | +51.69% | |
| Price / MAexp7: | +2.84% | |
| Price / MAexp20: | +12.94% | |
| Price / MAexp50: | +26.35% | |
| Price / MAexp100: | +35.90% |
News
Don"t forget to follow the news on BUILDERS FIRSTSOURCE INC.. At the time of publication of this analysis, the latest news was as follows:
- Thinking about trading options or stock in Builders FirstSource, Moderna Inc, GrubHub, Roku, or Ford Motor?
- Builders FirstSource Set to Join S&P MidCap 400; FB Financial & CoreCivic to Join S&P SmallCap 600
- Builders FirstSource, Inc. to Host Earnings Call
- Investor Network: Builders FirstSource, Inc. to Host Earnings Call
- Investor Network: Builders FirstSource, Inc. to Host Earnings Call
About author

Online


Add a comment
Comments
0 comments on the analysis BUILDERS FIRSTSOURCE INC. - Daily