EEMS - Daily - Technical analysis published on 12/11/2024 (GMT)
- 89
- 0
Click here for a new analysis!
- Timeframe : Daily
- - Analysis generated on
- Status : INVALID
Summary of the analysis

Additional analysis
Quotes
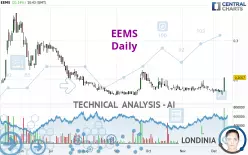
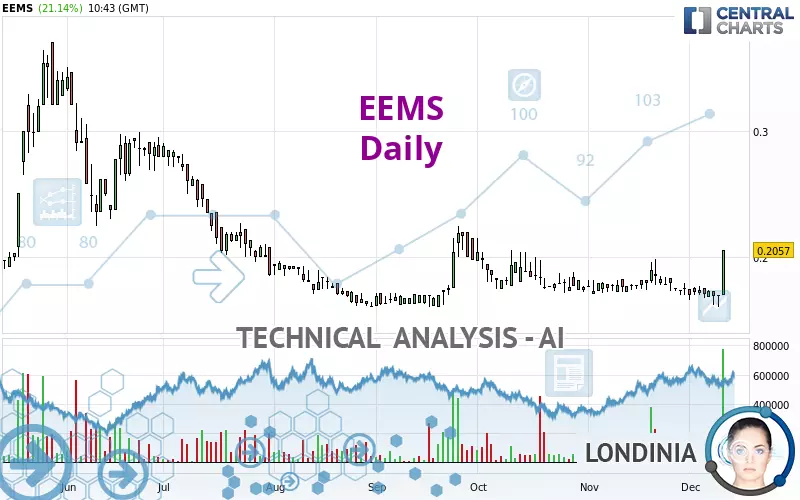
The EEMS price is 0.2057 EUR. On the day, this instrument gained +21.14% and was traded between 0.1699 EUR and 0.2057 EUR over the period. The price is currently at +21.07% from its lowest and 0% from its highest.A bullish opening was detected by the Central Gaps scanner. Buyers are trying to impose a bullish momentum in the very short term.
Bullish opening
Type : Bullish
Timeframe : Openning
Here is a more detailed summary of the historical variations registered by EEMS:
New LOW record (5 years)
Type : Bearish
Timeframe : Weekly
Near a new HIGH record (1 month)
Type : Bullish
Timeframe : Weekly
Abnormal volumes on EEMS were detected by the Central Volumes scanner:
Abnormal volumes
Timeframe : 5 days
Technical
Technical analysis of EEMS in Daily shows an overall slightly bullish trend. 53.57% of the signals given by moving averages are bullish. The overall trend could accelerate as strong bullish signals from short-term moving averages are expected. An assessment of moving averages reveals several bullish signals that could impact this trend:
Bullish price crossover with Moving Average 20
Type : Bullish
Timeframe : Daily
Bullish price crossover with Moving Average 50
Type : Bullish
Timeframe : Daily
Bullish price crossover with Moving Average 100
Type : Bullish
Timeframe : Daily
Bullish price crossover with adaptative moving average 20
Type : Bullish
Timeframe : Daily
Bullish price crossover with adaptative moving average 50
Type : Bullish
Timeframe : Daily
Bullish price crossover with adaptative moving average 100
Type : Bullish
Timeframe : Daily
On the 18 technical indicators analysed, 10 are bullish, 4 are neutral and 4 are bearish. But beware of excesses. The Central Indicators scanner currently detects this:
RSI indicator is overbought : over 70
Type : Neutral
Timeframe : Daily
CCI indicator is overbought : over 100
Type : Neutral
Timeframe : Daily
Williams %R indicator is overbought : over -20
Type : Neutral
Timeframe : Daily
Pivot points : price is over resistance 3
Type : Neutral
Timeframe : Daily
Pivot points : price is over resistance 3
Type : Neutral
Timeframe : Weekly
MACD crosses UP its Moving Average
Type : Bullish
Timeframe : Daily
Parabolic SAR indicator bullish reversal
Type : Bullish
Timeframe : Daily
Aroon indicator bullish trend
Type : Bullish
Timeframe : Daily
Ichimoku : price is over the cloud
Type : Bullish
Timeframe : Daily
SuperTrend indicator bullish reversal
Type : Bullish
Timeframe : Daily
MACD indicator is back over 0
Type : Bullish
Timeframe : Daily
Momentum indicator is back over 0
Type : Bullish
Timeframe : Daily
An analysis of the price chart with the Central Patterns scanner (detector of chart patterns and resistances and supports) shows several results that can have an impact on the price change:
Horizontal resistance is broken
Type : Bullish
Timeframe : Daily
Resistance of channel is broken
Type : Bullish
Timeframe : Daily
For a small rebound in the very short term, the Central Candlesticks scanner currently notes the presence of these bullish patterns in Japanese candlesticks:
White marubozu
Type : Bullish
Timeframe : Daily
Long white line
Type : Bullish
Timeframe : Daily
| S2 | S1 | Price | R1 | R2 | R3 | |
|---|---|---|---|---|---|---|
| ProTrendLines | 0.1617 | 0.1891 | 0.2057 | 0.2595 | 0.2920 | 0.3531 |
| Change (%) | -21.39% | -8.07% | - | +26.15% | +41.95% | +71.66% |
| Change | -0.0440 | -0.0166 | - | +0.0538 | +0.0863 | +0.1474 |
| Level | Major | Major | - | Minor | Minor | Intermediate |
To determine price objectives, it is also possible to use the pivot points. Here is the price position in relation to pivot points:
| Pivot points | S3 | S2 | S1 | PP | R1 | R2 | R3 |
|---|---|---|---|---|---|---|---|
| Standard | 0.1542 | 0.1574 | 0.1636 | 0.1668 | 0.1730 | 0.1762 | 0.1824 |
| Camarilla | 0.1672 | 0.1681 | 0.1689 | 0.1698 | 0.1707 | 0.1715 | 0.1724 |
| Woodie | 0.1557 | 0.1582 | 0.1651 | 0.1676 | 0.1745 | 0.1770 | 0.1839 |
| Fibonacci | 0.1574 | 0.1610 | 0.1632 | 0.1668 | 0.1704 | 0.1726 | 0.1762 |
| Pivot points | S3 | S2 | S1 | PP | R1 | R2 | R3 |
|---|---|---|---|---|---|---|---|
| Standard | 0.1566 | 0.1615 | 0.1672 | 0.1721 | 0.1778 | 0.1827 | 0.1884 |
| Camarilla | 0.1701 | 0.1711 | 0.1720 | 0.1730 | 0.1740 | 0.1749 | 0.1759 |
| Woodie | 0.1571 | 0.1617 | 0.1677 | 0.1723 | 0.1783 | 0.1829 | 0.1889 |
| Fibonacci | 0.1615 | 0.1655 | 0.1680 | 0.1721 | 0.1761 | 0.1786 | 0.1827 |
| Pivot points | S3 | S2 | S1 | PP | R1 | R2 | R3 |
|---|---|---|---|---|---|---|---|
| Standard | 0.1359 | 0.1530 | 0.1644 | 0.1815 | 0.1929 | 0.2100 | 0.2214 |
| Camarilla | 0.1681 | 0.1707 | 0.1733 | 0.1759 | 0.1785 | 0.1811 | 0.1837 |
| Woodie | 0.1332 | 0.1516 | 0.1617 | 0.1801 | 0.1902 | 0.2086 | 0.2187 |
| Fibonacci | 0.1530 | 0.1639 | 0.1706 | 0.1815 | 0.1924 | 0.1991 | 0.2100 |
Numerical data
The following is the status of technical indicators and moving averages registered at the time this technical analysis was created:
| RSI (14): | 65.92 | |
| MACD (12,26,9): | -0.0007 | |
| Directional Movement: | 17.2129 | |
| AROON (14): | -92.8571 | |
| DEMA (21): | 0.1758 | |
| Parabolic SAR (0,02-0,02-0,2): | 0.1606 | |
| Elder Ray (13): | 0.0062 | |
| Super Trend (3,10): | 0.1522 | |
| Zig ZAG (10): | 0.1960 | |
| VORTEX (21): | 0.9530 | |
| Stochastique (14,3,5): | 47.82 | |
| TEMA (21): | 0.1765 | |
| Williams %R (14): | 0.00 | |
| Chande Momentum Oscillator (20): | 0.0177 | |
| Repulse (5,40,3): | 20.4816 | |
| ROCnROLL: | 1 | |
| TRIX (15,9): | -0.1343 | |
| Courbe Coppock: | 5.93 |
| MA7: | 0.1750 | |
| MA20: | 0.1775 | |
| MA50: | 0.1799 | |
| MA100: | 0.1811 | |
| MAexp7: | 0.1778 | |
| MAexp20: | 0.1771 | |
| MAexp50: | 0.1802 | |
| MAexp100: | 0.1937 | |
| Price / MA7: | +17.54% | |
| Price / MA20: | +15.89% | |
| Price / MA50: | +14.34% | |
| Price / MA100: | +13.58% | |
| Price / MAexp7: | +15.69% | |
| Price / MAexp20: | +16.15% | |
| Price / MAexp50: | +14.15% | |
| Price / MAexp100: | +6.20% |
About author
Online


Add a comment
Comments
0 comments on the analysis EEMS - Daily