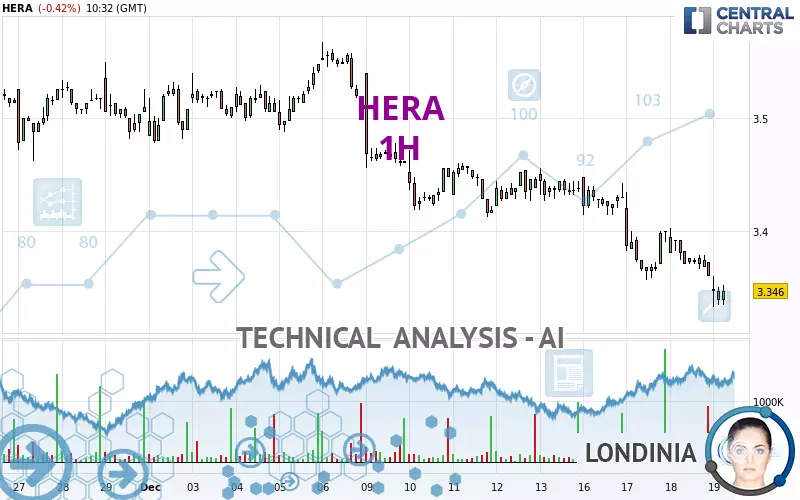
HERA - 1H - Technical analysis published on 12/19/2024 (GMT)
- 96
- 0
Click here for a new analysis!
- Timeframe : 1H
- - Analysis generated on
- Status : LEVEL MAINTAINED

Summary of the analysis

Additional analysis
Quotes
The HERA price is 3.346 EUR. On the day, this instrument lost -0.42% and was traded between 3.332 EUR and 3.360 EUR over the period. The price is currently at +0.42% from its lowest and -0.42% from its highest.The Central Gaps scanner detects a bearish gap which is a sign that the sellers have taken the lead in the very short term.
Opening Gap DOWN
Type : Bearish
Timeframe : Openning
So that you have an overall view of the price change, here is a table showing the variations over several periods:
New LOW record (1 month)
Type : Bearish
Timeframe : Weekly
Technical
A technical analysis in 1H of this HERA chart shows a sharp bearish trend. 92.86% of the signals given by moving averages are bearish. The overall trend is supported by the strong bearish signals from short-term moving averages. The Central Indicators market scanner currently does not detect any result that concerns moving averages.
The probability of a further decline is high given the direction of the technical indicators.
Caution: the Central Indicators scanner currently detects an excess:
CCI indicator is oversold : under -100
Type : Neutral
Timeframe : 1 hour
Previous candle closed under Bollinger bands
Type : Neutral
Timeframe : 1 hour
CCI indicator: bullish divergence
Type : Bullish
Timeframe : 1 hour
RSI indicator: bullish divergence
Type : Bullish
Timeframe : 1 hour
Williams %R indicator is oversold : under -80
Type : Neutral
Timeframe : 1 hour
Pivot points : price is under support 1
Type : Neutral
Timeframe : Weekly
An analysis of the price chart with the Central Patterns scanner (detector of chart patterns and resistances and supports) shows a result that can have an impact on the price change:
Near horizontal support
Type : Bullish
Timeframe : 1 hour
The Central Candlesticks scanner, specialised in Japanese candlesticks, did not identify any signals.
| S3 | S2 | S1 | Price | R1 | R2 | R3 | |
|---|---|---|---|---|---|---|---|
| ProTrendLines | 2.992 | 3.101 | 3.235 | 3.346 | 3.350 | 3.413 | 3.461 |
| Change (%) | -10.58% | -7.32% | -3.32% | - | +0.12% | +2.00% | +3.44% |
| Change | -0.354 | -0.245 | -0.111 | - | +0.004 | +0.067 | +0.115 |
| Level | Intermediate | Major | Minor | - | Major | Intermediate | Major |
Pivot points can also be used to set your price objectives. Here is the price situation in relation to pivot points:
| Pivot points | S3 | S2 | S1 | PP | R1 | R2 | R3 |
|---|---|---|---|---|---|---|---|
| Standard | 3.304 | 3.332 | 3.346 | 3.374 | 3.388 | 3.416 | 3.430 |
| Camarilla | 3.349 | 3.352 | 3.356 | 3.360 | 3.364 | 3.368 | 3.372 |
| Woodie | 3.297 | 3.329 | 3.339 | 3.371 | 3.381 | 3.413 | 3.423 |
| Fibonacci | 3.332 | 3.348 | 3.358 | 3.374 | 3.390 | 3.400 | 3.416 |
| Pivot points | S3 | S2 | S1 | PP | R1 | R2 | R3 |
|---|---|---|---|---|---|---|---|
| Standard | 3.259 | 3.335 | 3.387 | 3.463 | 3.515 | 3.591 | 3.643 |
| Camarilla | 3.403 | 3.415 | 3.426 | 3.438 | 3.450 | 3.462 | 3.473 |
| Woodie | 3.246 | 3.329 | 3.374 | 3.457 | 3.502 | 3.585 | 3.630 |
| Fibonacci | 3.335 | 3.384 | 3.414 | 3.463 | 3.512 | 3.542 | 3.591 |
| Pivot points | S3 | S2 | S1 | PP | R1 | R2 | R3 |
|---|---|---|---|---|---|---|---|
| Standard | 3.071 | 3.181 | 3.345 | 3.455 | 3.619 | 3.729 | 3.893 |
| Camarilla | 3.435 | 3.460 | 3.485 | 3.510 | 3.535 | 3.560 | 3.585 |
| Woodie | 3.099 | 3.195 | 3.373 | 3.469 | 3.647 | 3.743 | 3.921 |
| Fibonacci | 3.181 | 3.285 | 3.350 | 3.455 | 3.559 | 3.624 | 3.729 |
Numerical data
The following are the details of the technical indicators and moving averages that were collected to generate this technical analysis:
| RSI (14): | 27.80 | |
| MACD (12,26,9): | -0.0170 | |
| Directional Movement: | -26.187 | |
| AROON (14): | -64.286 | |
| DEMA (21): | 3.356 | |
| Parabolic SAR (0,02-0,02-0,2): | 3.398 | |
| Elder Ray (13): | -0.027 | |
| Super Trend (3,10): | 3.387 | |
| Zig ZAG (10): | 3.338 | |
| VORTEX (21): | 0.7310 | |
| Stochastique (14,3,5): | 11.47 | |
| TEMA (21): | 3.351 | |
| Williams %R (14): | -94.29 | |
| Chande Momentum Oscillator (20): | -0.062 | |
| Repulse (5,40,3): | -0.6830 | |
| ROCnROLL: | 2 | |
| TRIX (15,9): | -0.0620 | |
| Courbe Coppock: | 1.26 |
| MA7: | 3.403 | |
| MA20: | 3.469 | |
| MA50: | 3.508 | |
| MA100: | 3.486 | |
| MAexp7: | 3.353 | |
| MAexp20: | 3.377 | |
| MAexp50: | 3.405 | |
| MAexp100: | 3.431 | |
| Price / MA7: | -1.67% | |
| Price / MA20: | -3.55% | |
| Price / MA50: | -4.62% | |
| Price / MA100: | -4.02% | |
| Price / MAexp7: | -0.21% | |
| Price / MAexp20: | -0.92% | |
| Price / MAexp50: | -1.73% | |
| Price / MAexp100: | -2.48% |
News
Don't forget to follow the news on HERA. At the time of publication of this analysis, the latest news was as follows:
-
 Watch live: European spacecraft Hera launches to asteroid that got smacked by NASA
- Gruppo Hera SpA Assigned ESG Evaluation Of 81; Preparedness Strong
- Hera Kitwan Siu Elected to Goodyear Board
- Excellent Preclinical Efficacy Data of Apogenix' HERA-GITRL Published in Journal for ImmunoTherapy of Cancer
- 2019 HERA Hong Kong ESG Reporting Awards: Submissions are Now Open
About author
Online


Add a comment
Comments
0 comments on the analysis HERA - 1H