HERA - Daily - Technical analysis published on 12/08/2023 (GMT)
- 174
- 0
Click here for a new analysis!
- Timeframe : Daily
- - Analysis generated on
- Status : LEVEL MAINTAINED

Summary of the analysis

Additional analysis
Quotes
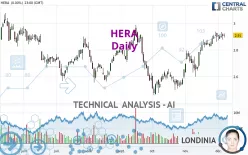
The HERA price is 2.934 EUR. On the day, this instrument gained +0.83% with the lowest point at 2.904 EUR and the highest point at 2.934 EUR. The deviation from the price is +1.03% for the low point and 0% for the high point.A bullish opening was detected by the Central Gaps scanner. Buyers are trying to impose a bullish momentum in the very short term.
Bullish opening
Type : Bullish
Timeframe : Openning
A study of price movements over other periods shows the following variations:
Near a new HIGH record (1 year)
Type : Bullish
Timeframe : Weekly
Near a new HIGH record (1st january)
Type : Bullish
Timeframe : Weekly
Near a new HIGH record (1 month)
Type : Bullish
Timeframe : Weekly
Technical
Technical analysis of this Daily chart of HERA indicates that the overall trend is strongly bullish. The signals given by the moving averages are 89.29% bullish. This strong bullish trend is confirmed by the strong signals currently being given by short-term moving averages. The Central Indicators market scanner currently does not detect any result that concerns moving averages.
In fact, according to the parameters integrated into the Central Analyzer system, 14 technical indicators out of 18 analysed are currently bullish. Caution: the Central Indicators scanner currently detects an excess:
RSI indicator is overbought : over 70
Type : Neutral
Timeframe : Daily
Williams %R indicator is overbought : over -20
Type : Neutral
Timeframe : Daily
Pivot points : price is over resistance 1
Type : Neutral
Timeframe : Daily
The Central Patterns scanner, which studies chart patterns, resistances and supports, has identified these signals:
Near horizontal resistance
Type : Bearish
Timeframe : Daily
Near resistance of channel
Type : Bearish
Timeframe : Daily
Near resistance of triangle
Type : Bearish
Timeframe : Daily
No result was found by the Central Candlesticks scanner on Japanese candlesticks.
| S3 | S2 | S1 | Price | R1 | R2 | R3 | |
|---|---|---|---|---|---|---|---|
| ProTrendLines | 2.578 | 2.709 | 2.833 | 2.934 | 2.935 | 3.220 | 3.610 |
| Change (%) | -12.13% | -7.67% | -3.44% | - | +0.03% | +9.75% | +23.04% |
| Change | -0.356 | -0.225 | -0.101 | - | +0.001 | +0.286 | +0.676 |
| Level | Major | Minor | Major | - | Major | Minor | Intermediate |
Pivot points can also be used to set your price objectives. Here is the price situation in relation to pivot points:
| Pivot points | S3 | S2 | S1 | PP | R1 | R2 | R3 |
|---|---|---|---|---|---|---|---|
| Standard | 2.861 | 2.877 | 2.893 | 2.909 | 2.925 | 2.941 | 2.957 |
| Camarilla | 2.901 | 2.904 | 2.907 | 2.910 | 2.913 | 2.916 | 2.919 |
| Woodie | 2.862 | 2.877 | 2.894 | 2.909 | 2.926 | 2.941 | 2.958 |
| Fibonacci | 2.877 | 2.889 | 2.896 | 2.909 | 2.921 | 2.928 | 2.941 |
| Pivot points | S3 | S2 | S1 | PP | R1 | R2 | R3 |
|---|---|---|---|---|---|---|---|
| Standard | 2.764 | 2.804 | 2.856 | 2.896 | 2.948 | 2.988 | 3.040 |
| Camarilla | 2.883 | 2.891 | 2.900 | 2.908 | 2.916 | 2.925 | 2.933 |
| Woodie | 2.770 | 2.807 | 2.862 | 2.899 | 2.954 | 2.991 | 3.046 |
| Fibonacci | 2.804 | 2.839 | 2.861 | 2.896 | 2.931 | 2.953 | 2.988 |
| Pivot points | S3 | S2 | S1 | PP | R1 | R2 | R3 |
|---|---|---|---|---|---|---|---|
| Standard | 2.349 | 2.473 | 2.687 | 2.811 | 3.025 | 3.149 | 3.363 |
| Camarilla | 2.807 | 2.838 | 2.869 | 2.900 | 2.931 | 2.962 | 2.993 |
| Woodie | 2.393 | 2.496 | 2.731 | 2.834 | 3.069 | 3.172 | 3.407 |
| Fibonacci | 2.473 | 2.602 | 2.682 | 2.811 | 2.940 | 3.020 | 3.149 |
Numerical data
The following is the status of the technical indicators and moving averages at the time of publication of this technical analysis:
| RSI (14): | 70.73 | |
| MACD (12,26,9): | 0.0570 | |
| Directional Movement: | 10.911 | |
| AROON (14): | 50.000 | |
| DEMA (21): | 2.929 | |
| Parabolic SAR (0,02-0,02-0,2): | 2.853 | |
| Elder Ray (13): | 0.036 | |
| Super Trend (3,10): | 2.784 | |
| Zig ZAG (10): | 2.934 | |
| VORTEX (21): | 1.2360 | |
| Stochastique (14,3,5): | 83.02 | |
| TEMA (21): | 2.949 | |
| Williams %R (14): | -1.79 | |
| Chande Momentum Oscillator (20): | 0.092 | |
| Repulse (5,40,3): | 0.8090 | |
| ROCnROLL: | 1 | |
| TRIX (15,9): | 0.3200 | |
| Courbe Coppock: | 7.41 |
| MA7: | 2.906 | |
| MA20: | 2.859 | |
| MA50: | 2.709 | |
| MA100: | 2.727 | |
| MAexp7: | 2.906 | |
| MAexp20: | 2.853 | |
| MAexp50: | 2.777 | |
| MAexp100: | 2.735 | |
| Price / MA7: | +0.96% | |
| Price / MA20: | +2.62% | |
| Price / MA50: | +8.31% | |
| Price / MA100: | +7.59% | |
| Price / MAexp7: | +0.96% | |
| Price / MAexp20: | +2.84% | |
| Price / MAexp50: | +5.65% | |
| Price / MAexp100: | +7.28% |
News
The last news published on HERA at the time of the generation of this analysis was as follows:
- Gruppo Hera SpA Assigned ESG Evaluation Of 81; Preparedness Strong
- Hera Kitwan Siu Elected to Goodyear Board
- Excellent Preclinical Efficacy Data of Apogenix' HERA-GITRL Published in Journal for ImmunoTherapy of Cancer
- 2019 HERA Hong Kong ESG Reporting Awards: Submissions are Now Open
- ESA and GomSpace Sign Contract for Advanced Nanosatellite to Join the HERA Mission
About author
Online


Add a comment
Comments
0 comments on the analysis HERA - Daily