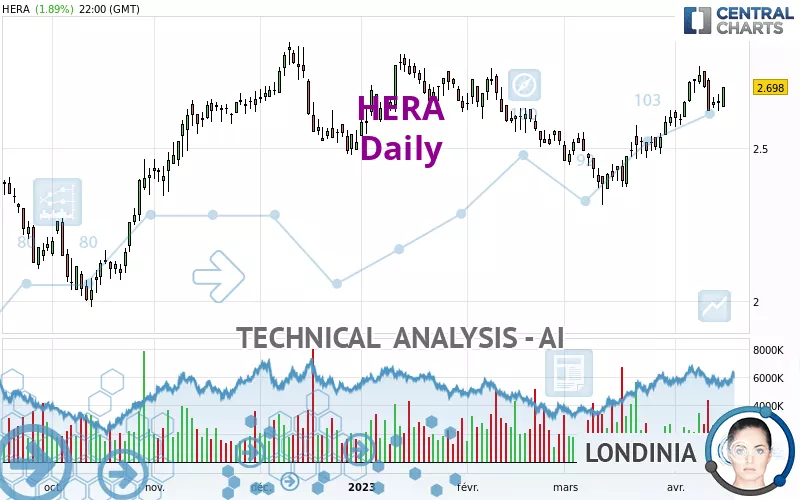
HERA - Daily - Technical analysis published on 04/19/2023 (GMT)
- 175
- 0
Click here for a new analysis!
- Timeframe : Daily
- - Analysis generated on
- Status : TARGET REACHED

Summary of the analysis

Additional analysis
Quotes
The HERA price is 2.698 EUR. The price has increased by +1.89% since the last closing and was between 2.634 EUR and 2.700 EUR. This implies that the price is at +2.43% from its lowest and at -0.07% from its highest.A bearish opening was detected by the Central Gaps scanner. Sellers are trying to impose a bearish trend in the very short term.
Bearish opening
Type : Bearish
Timeframe : Openning
Here is a more detailed summary of the historical variations registered by HERA:
Near a new HIGH record (1st january)
Type : Bullish
Timeframe : Weekly
Near a new HIGH record (1 month)
Type : Bullish
Timeframe : Weekly
Technical
A technical analysis in Daily of this HERA chart shows a strongly bullish trend. 82.14% of the signals given by moving averages are bullish. The overall trend is supported by the strong bullish signals from short-term moving averages. There is no crossing of moving average by the price or crossing of moving averages between themselves.
An assessment of technical indicators shows a moderate bullish signal.
Other results related to technical indicators were also found by the Central Indicators scanner:
Pivot points : price is over resistance 1
Type : Neutral
Timeframe : Daily
Price is back over the pivot point
Type : Bullish
Timeframe : Weekly
No signals are given by Central Patterns, a market scanner specialised in chart patterns, resistances and supports.
The presence of a bullish Japanese candlestick pattern detected by Central Candlesticks that could cause a very short term rebound was also detected:
Bullish engulfing lines
Type : Bullish
Timeframe : Daily
| S3 | S2 | S1 | Price | R1 | R2 | R3 | |
|---|---|---|---|---|---|---|---|
| ProTrendLines | 2.383 | 2.490 | 2.598 | 2.698 | 2.830 | 3.365 | 3.772 |
| Change (%) | -11.68% | -7.71% | -3.71% | - | +4.89% | +24.72% | +39.81% |
| Change | -0.315 | -0.208 | -0.100 | - | +0.132 | +0.667 | +1.074 |
| Level | Intermediate | Major | Major | - | Major | Minor | Intermediate |
Attention could also be paid to pivot points to set price objectives:
| Pivot points | S3 | S2 | S1 | PP | R1 | R2 | R3 |
|---|---|---|---|---|---|---|---|
| Standard | 2.567 | 2.595 | 2.621 | 2.649 | 2.675 | 2.703 | 2.729 |
| Camarilla | 2.633 | 2.638 | 2.643 | 2.648 | 2.653 | 2.658 | 2.663 |
| Woodie | 2.567 | 2.595 | 2.621 | 2.649 | 2.675 | 2.703 | 2.729 |
| Fibonacci | 2.595 | 2.615 | 2.628 | 2.649 | 2.669 | 2.682 | 2.703 |
| Pivot points | S3 | S2 | S1 | PP | R1 | R2 | R3 |
|---|---|---|---|---|---|---|---|
| Standard | 2.424 | 2.522 | 2.572 | 2.670 | 2.720 | 2.818 | 2.868 |
| Camarilla | 2.581 | 2.595 | 2.608 | 2.622 | 2.636 | 2.649 | 2.663 |
| Woodie | 2.400 | 2.510 | 2.548 | 2.658 | 2.696 | 2.806 | 2.844 |
| Fibonacci | 2.522 | 2.579 | 2.614 | 2.670 | 2.727 | 2.762 | 2.818 |
| Pivot points | S3 | S2 | S1 | PP | R1 | R2 | R3 |
|---|---|---|---|---|---|---|---|
| Standard | 2.094 | 2.204 | 2.403 | 2.513 | 2.712 | 2.822 | 3.021 |
| Camarilla | 2.517 | 2.545 | 2.574 | 2.602 | 2.630 | 2.659 | 2.687 |
| Woodie | 2.139 | 2.226 | 2.448 | 2.535 | 2.757 | 2.844 | 3.066 |
| Fibonacci | 2.204 | 2.322 | 2.395 | 2.513 | 2.631 | 2.704 | 2.822 |
Numerical data
The following is the status of the technical indicators and moving averages at the time of publication of this technical analysis:
| RSI (14): | 61.78 | |
| MACD (12,26,9): | 0.0440 | |
| Directional Movement: | 11.923 | |
| AROON (14): | 57.143 | |
| DEMA (21): | 2.670 | |
| Parabolic SAR (0,02-0,02-0,2): | 2.759 | |
| Elder Ray (13): | 0.023 | |
| Super Trend (3,10): | 2.564 | |
| Zig ZAG (10): | 2.700 | |
| VORTEX (21): | 1.1780 | |
| Stochastique (14,3,5): | 64.46 | |
| TEMA (21): | 2.711 | |
| Williams %R (14): | -23.69 | |
| Chande Momentum Oscillator (20): | 0.114 | |
| Repulse (5,40,3): | 1.7160 | |
| ROCnROLL: | 1 | |
| TRIX (15,9): | 0.2210 | |
| Courbe Coppock: | 12.70 |
| MA7: | 2.683 | |
| MA20: | 2.605 | |
| MA50: | 2.557 | |
| MA100: | 2.609 | |
| MAexp7: | 2.668 | |
| MAexp20: | 2.618 | |
| MAexp50: | 2.585 | |
| MAexp100: | 2.591 | |
| Price / MA7: | +0.56% | |
| Price / MA20: | +3.57% | |
| Price / MA50: | +5.51% | |
| Price / MA100: | +3.41% | |
| Price / MAexp7: | +1.12% | |
| Price / MAexp20: | +3.06% | |
| Price / MAexp50: | +4.37% | |
| Price / MAexp100: | +4.13% |
News
Don't forget to follow the news on HERA. At the time of publication of this analysis, the latest news was as follows:
- Gruppo Hera SpA Assigned ESG Evaluation Of 81; Preparedness Strong
- Hera Kitwan Siu Elected to Goodyear Board
- Excellent Preclinical Efficacy Data of Apogenix' HERA-GITRL Published in Journal for ImmunoTherapy of Cancer
- 2019 HERA Hong Kong ESG Reporting Awards: Submissions are Now Open
- ESA and GomSpace Sign Contract for Advanced Nanosatellite to Join the HERA Mission
About author
Online


Add a comment
Comments
0 comments on the analysis HERA - Daily