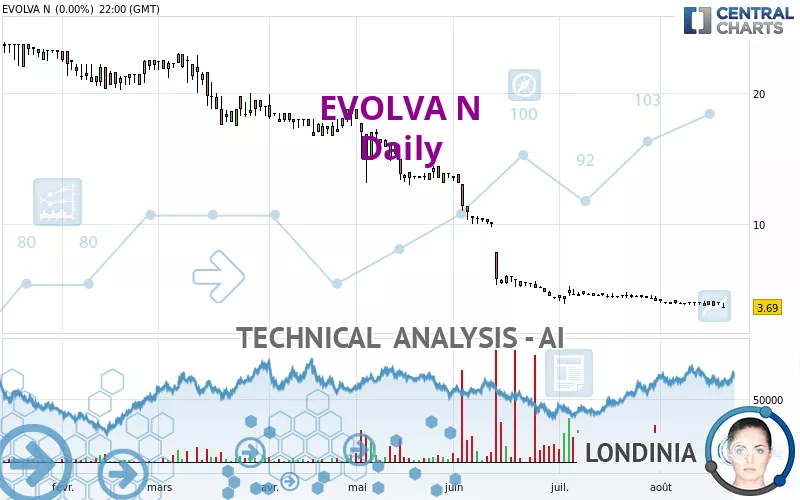
EVOLVA N - Daily - Technical analysis published on 08/22/2023 (GMT)
- 224
- 0
Click here for a new analysis!
- Timeframe : Daily
- - Analysis generated on
- Status : TARGET REACHED
Summary of the analysis

Additional analysis
Quotes
The EVOLVA N rating is 3.9700 CHF. The price registered an increase of +7.59% on the session with the lowest point at 3.6300 CHF and the highest point at 3.9900 CHF. The deviation from the price is +9.37% for the low point and -0.50% for the high point.A bullish opening was detected by the Central Gaps scanner. Buyers are trying to impose a bullish momentum in the very short term.
Bullish opening
Type : Bullish
Timeframe : Openning
Here is a more detailed summary of the historical variations registered by EVOLVA N:
New LOW record (5 years)
Type : Bearish
Timeframe : Weekly
New LOW record (1 year)
Type : Bearish
Timeframe : Weekly
New LOW record (1st january)
Type : Bearish
Timeframe : Weekly
New LOW record (1 month)
Type : Bearish
Timeframe : Weekly
Abnormal volumes on EVOLVA N were detected by the Central Volumes scanner:
Abnormal volumes
Timeframe : 50 days
Technical
Technical analysis of this Daily chart of EVOLVA N indicates that the overall trend is strongly bearish. The signals given by moving averages are 92.86% bearish. This strong bearish trend is confirmed by the strong signals currently being given by short-term moving averages. An assessment of moving averages reveals a bullish signal that could impact this trend:
Bullish price crossover with adaptative moving average 50
Type : Bullish
Timeframe : Daily
An assessment of technical indicators does not currently provide any relevant information on the direction of future price movements.
Caution: the Central Indicators scanner currently detects an excess:
CCI indicator: bullish divergence
Type : Bullish
Timeframe : Daily
Pivot points : price is over resistance 1
Type : Neutral
Timeframe : Daily
Price is back over the pivot point
Type : Bullish
Timeframe : Weekly
Momentum indicator is back over 0
Type : Bullish
Timeframe : Daily
Williams %R indicator is back over -50
Type : Bullish
Timeframe : Daily
No signals are given by Central Patterns, a market scanner specialised in chart patterns, resistances and supports.
The Central Candlesticks scanner which studies Japanese candlesticks did not detect anything.
| Price | R1 | R2 | R3 | |
|---|---|---|---|---|
| ProTrendLines | 3.9700 | 4.4900 | 13.5000 | 18.8500 |
| Change (%) | - | +13.10% | +240.05% | +374.81% |
| Change | - | +0.5200 | +9.5300 | +14.8800 |
| Level | - | Minor | Minor | Intermediate |
Pivot points can also be used to set your price objectives. Here is the price situation in relation to pivot points:
| Pivot points | S3 | S2 | S1 | PP | R1 | R2 | R3 |
|---|---|---|---|---|---|---|---|
| Standard | 3.2767 | 3.4833 | 3.5867 | 3.7933 | 3.8967 | 4.1033 | 4.2067 |
| Camarilla | 3.6048 | 3.6332 | 3.6616 | 3.6900 | 3.7184 | 3.7468 | 3.7753 |
| Woodie | 3.2250 | 3.4575 | 3.5350 | 3.7675 | 3.8450 | 4.0775 | 4.1550 |
| Fibonacci | 3.4833 | 3.6018 | 3.6749 | 3.7933 | 3.9118 | 3.9849 | 4.1033 |
| Pivot points | S3 | S2 | S1 | PP | R1 | R2 | R3 |
|---|---|---|---|---|---|---|---|
| Standard | 3.3500 | 3.5400 | 3.7700 | 3.9600 | 4.1900 | 4.3800 | 4.6100 |
| Camarilla | 3.8845 | 3.9230 | 3.9615 | 4.0000 | 4.0385 | 4.0770 | 4.1155 |
| Woodie | 3.3700 | 3.5500 | 3.7900 | 3.9700 | 4.2100 | 4.3900 | 4.6300 |
| Fibonacci | 3.5400 | 3.7004 | 3.7996 | 3.9600 | 4.1204 | 4.2196 | 4.3800 |
| Pivot points | S3 | S2 | S1 | PP | R1 | R2 | R3 |
|---|---|---|---|---|---|---|---|
| Standard | 2.2400 | 3.0700 | 3.6000 | 4.4300 | 4.9600 | 5.7900 | 6.3200 |
| Camarilla | 3.7560 | 3.8807 | 4.0053 | 4.1300 | 4.2547 | 4.3793 | 4.5040 |
| Woodie | 2.0900 | 2.9950 | 3.4500 | 4.3550 | 4.8100 | 5.7150 | 6.1700 |
| Fibonacci | 3.0700 | 3.5895 | 3.9105 | 4.4300 | 4.9495 | 5.2705 | 5.7900 |
Numerical data
The following is the status of technical indicators and moving averages registered at the time this technical analysis was created:
| RSI (14): | 39.60 | |
| MACD (12,26,9): | -0.3728 | |
| Directional Movement: | -12.6487 | |
| AROON (14): | -100.0000 | |
| DEMA (21): | 3.5608 | |
| Parabolic SAR (0,02-0,02-0,2): | 4.1098 | |
| Elder Ray (13): | -0.1851 | |
| Super Trend (3,10): | 4.7087 | |
| Zig ZAG (10): | 3.9700 | |
| VORTEX (21): | 0.8380 | |
| Stochastique (14,3,5): | 30.73 | |
| TEMA (21): | 4.0346 | |
| Williams %R (14): | -40.35 | |
| Chande Momentum Oscillator (20): | 0.0400 | |
| Repulse (5,40,3): | 2.7120 | |
| ROCnROLL: | 2 | |
| TRIX (15,9): | -1.4637 | |
| Courbe Coppock: | 14.59 |
| MA7: | 3.9343 | |
| MA20: | 4.0765 | |
| MA50: | 4.6936 | |
| MA100: | 10.2186 | |
| MAexp7: | 3.9219 | |
| MAexp20: | 4.1418 | |
| MAexp50: | 5.8211 | |
| MAexp100: | 9.2352 | |
| Price / MA7: | +0.91% | |
| Price / MA20: | -2.61% | |
| Price / MA50: | -15.42% | |
| Price / MA100: | -61.15% | |
| Price / MAexp7: | +1.23% | |
| Price / MAexp20: | -4.15% | |
| Price / MAexp50: | -31.80% | |
| Price / MAexp100: | -57.01% |
News
Don't forget to follow the news on EVOLVA N. At the time of publication of this analysis, the latest news was as follows:
- Evolva signs multi-year agreement with leading CMO partner to enable supply of Vanillin to global F&F customer of around CHF 35 million until 2026
- Evolva publishes timeline of the Reverse Stock Split
- Evolva shareholders approve all motions proposed by the Board at today’s Annual General Meeting
- Evolva goes Responsible Care at in-cosmetics 2023
- Evolva publishes agenda for 2023 Annual General Meeting
About author
Online


Add a comment
Comments
0 comments on the analysis EVOLVA N - Daily