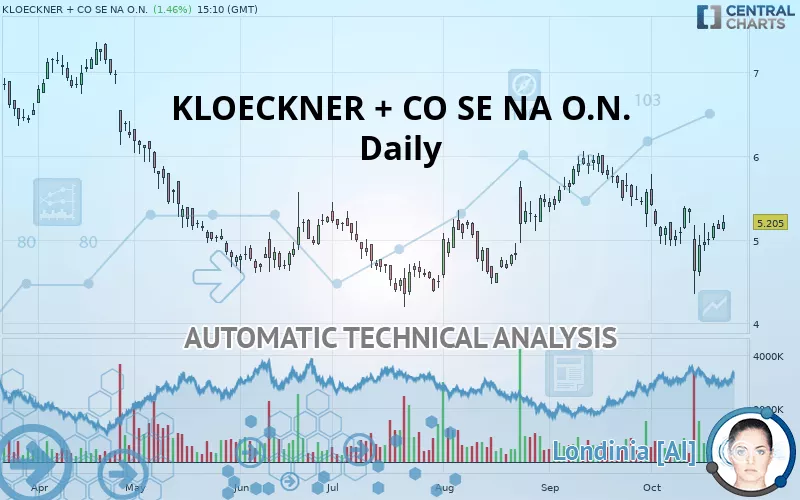
KLOECKNER + CO SE NA O.N. - Daily - Technical analysis published on 10/23/2019 (GMT)
- 352
- 0
- Who voted?
- Timeframe : Daily
- - Analysis generated on
- Status : NEUTRAL
Summary of the analysis

Additional analysis
Quotes
The KLOECKNER + CO SE NA O.N. price is 5.205 EUR. On the day, this instrument gained +1.46% and was between 5.100 EUR and 5.295 EUR. This implies that the price is at +2.06% from its lowest and at -1.70% from its highest.A bearish gap was detected at the opening by the Central Gaps scanner. There are a lot of sellers and they have the upper hand in the very short term.
Opening Gap DOWN
Type : Bearish
Timeframe : Openning
A study of price movements over other periods shows the following variations:
Technical
A technical analysis in Daily of this KLOECKNER + CO SE NA O.N. chart shows a slightly bearish trend. 46.43% of the signals given by moving averages are bearish. As the signals currently given by short-term moving averages are rather neutral, the slightly bearish trend could return to neutral. The Central Indicators scanner detects a bearish signal on moving averages that could impact this trend:
Bearish price crossover with adaptative moving average 50
Type : Bearish
Timeframe : Daily
The technical indicators are bullish. There is still some doubt about the price increase.
Central Indicators, the detector scanner for these technical indicators has recently detected several signals:
Pivot points : price is over resistance 1
Type : Neutral
Timeframe : Daily
Parabolic SAR indicator bullish reversal
Type : Bullish
Timeframe : Daily
Price is back under the pivot point
Type : Bearish
Timeframe : Daily
Momentum indicator is back over 0
Type : Bullish
Timeframe : Daily
An analysis of the price chart with the Central Patterns scanner (detector of chart patterns and resistances and supports) shows several results that can have an impact on the price change:
Near resistance of channel
Type : Bearish
Timeframe : Daily
Near resistance of triangle
Type : Bearish
Timeframe : Daily
No result was found by the Central Candlesticks scanner on Japanese candlesticks.
| S3 | S2 | S1 | Price | R1 | R2 | R3 | |
|---|---|---|---|---|---|---|---|
| ProTrendLines | 4.350 | 4.662 | 5.040 | 5.205 | 5.265 | 6.000 | 6.644 |
| Change (%) | -16.43% | -10.43% | -3.17% | - | +1.15% | +15.27% | +27.65% |
| Change | -0.855 | -0.543 | -0.165 | - | +0.060 | +0.795 | +1.439 |
| Level | Major | Major | Intermediate | - | Minor | Minor | Intermediate |
Pivot points can also be used to set your price objectives. Here is the price situation in relation to pivot points:
| Pivot points | S3 | S2 | S1 | PP | R1 | R2 | R3 |
|---|---|---|---|---|---|---|---|
| Standard | 4.982 | 5.053 | 5.092 | 5.163 | 5.202 | 5.273 | 5.312 |
| Camarilla | 5.100 | 5.110 | 5.120 | 5.130 | 5.140 | 5.150 | 5.160 |
| Woodie | 4.965 | 5.045 | 5.075 | 5.155 | 5.185 | 5.265 | 5.295 |
| Fibonacci | 5.053 | 5.095 | 5.121 | 5.163 | 5.205 | 5.231 | 5.273 |
| Pivot points | S3 | S2 | S1 | PP | R1 | R2 | R3 |
|---|---|---|---|---|---|---|---|
| Standard | 3.413 | 3.883 | 4.436 | 4.906 | 5.459 | 5.929 | 6.482 |
| Camarilla | 4.709 | 4.803 | 4.896 | 4.990 | 5.084 | 5.178 | 5.271 |
| Woodie | 3.456 | 3.904 | 4.479 | 4.927 | 5.502 | 5.950 | 6.525 |
| Fibonacci | 3.883 | 4.274 | 4.515 | 4.906 | 5.297 | 5.538 | 5.929 |
| Pivot points | S3 | S2 | S1 | PP | R1 | R2 | R3 |
|---|---|---|---|---|---|---|---|
| Standard | 4.207 | 4.678 | 5.122 | 5.593 | 6.037 | 6.508 | 6.952 |
| Camarilla | 5.313 | 5.397 | 5.481 | 5.565 | 5.649 | 5.733 | 5.817 |
| Woodie | 4.193 | 4.671 | 5.108 | 5.586 | 6.023 | 6.501 | 6.938 |
| Fibonacci | 4.678 | 5.028 | 5.244 | 5.593 | 5.943 | 6.159 | 6.508 |
Numerical data
The following is the status of technical indicators and moving averages registered at the time this technical analysis was created:
| RSI (14): | 49.49 | |
| MACD (12,26,9): | -0.0930 | |
| Directional Movement: | -7.280 | |
| AROON (14): | -14.286 | |
| DEMA (21): | 5.073 | |
| Parabolic SAR (0,02-0,02-0,2): | 4.370 | |
| Elder Ray (13): | 0.063 | |
| Super Trend (3,10): | 5.700 | |
| Zig ZAG (10): | 5.210 | |
| VORTEX (21): | 0.9050 | |
| Stochastique (14,3,5): | 71.01 | |
| TEMA (21): | 4.975 | |
| Williams %R (14): | -18.61 | |
| Chande Momentum Oscillator (20): | 0.065 | |
| Repulse (5,40,3): | 1.4680 | |
| ROCnROLL: | -1 | |
| TRIX (15,9): | -0.2890 | |
| Courbe Coppock: | 9.63 |
| MA7: | 5.001 | |
| MA20: | 5.182 | |
| MA50: | 5.317 | |
| MA100: | 5.085 | |
| MAexp7: | 5.107 | |
| MAexp20: | 5.188 | |
| MAexp50: | 5.248 | |
| MAexp100: | 5.341 | |
| Price / MA7: | +4.08% | |
| Price / MA20: | +0.44% | |
| Price / MA50: | -2.11% | |
| Price / MA100: | +2.36% | |
| Price / MAexp7: | +1.92% | |
| Price / MAexp20: | +0.33% | |
| Price / MAexp50: | -0.82% | |
| Price / MAexp100: | -2.55% |
News
Don"t forget to follow the news on KLOECKNER + CO SE NA O.N.. At the time of publication of this analysis, the latest news was as follows:
- DGAP-Adhoc: Klöckner & Co SE: Guidance for full year 2019 - operating income (EBITDA) burdened
- DGAP-News: Klöckner & Co SE reports market-related impacts on earnings in second quarter of 2019
- DGAP-News: Klöckner & Co SE reorganizes Management Board and strengthens country organizations
- DGAP-Adhoc: Klöckner & Co SE: Guidance for the full year - operating income (EBITDA) burdened by general economic development
- DGAP-News: Klöckner & Co SE reports lower earnings in first quarter of 2019
About author

Online


Add a comment
Comments
0 comments on the analysis KLOECKNER + CO SE NA O.N. - Daily