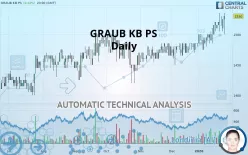
GRAUB KB PS - Daily - Technical analysis published on 01/29/2020 (GMT)
- 253
- 0
Click here for a new analysis!
- Timeframe : Daily
- - Analysis generated on
- Status : TARGET REACHED

Summary of the analysis

Additional analysis
Quotes
The GRAUB KB PS rating is 1,530.00 CHF. On the day, this instrument gained +0.33% with the lowest point at 1,500.00 CHF and the highest point at 1,535.00 CHF. The deviation from the price is +2.00% for the low point and -0.33% for the high point.A bearish opening was detected by the Central Gaps scanner. Sellers are trying to impose a bearish trend in the very short term.
Bearish opening
Type : Bearish
Timeframe : Openning
So that you have an overall view of the price change, here is a table showing the variations over several periods:
Near a new HIGH record (1 year)
Type : Bullish
Timeframe : Weekly
Technical
A technical analysis in Daily of this GRAUB KB PS chart shows a strongly bullish trend. The signals given by the moving averages are 92.86% bullish. This strong bullish trend is confirmed by the strong signals currently being given by short-term moving averages. There is no crossing of moving average by the price or crossing of moving averages between themselves.
In fact, 13 technical indicators on 18 studied are currently positioned bullish. Caution: the Central Indicators scanner currently detects an excess:
CCI indicator is overbought : over 100
Type : Neutral
Timeframe : Daily
MACD indicator: bearish divergence
Type : Bearish
Timeframe : Daily
Williams %R indicator is overbought : over -20
Type : Neutral
Timeframe : Daily
Price is back over the pivot point
Type : Bullish
Timeframe : Weekly
The Central Patterns scanner, which studies chart patterns, resistances and supports, has identified these signals:
Near resistance of channel
Type : Bearish
Timeframe : Daily
Horizontal resistance is broken
Type : Bullish
Timeframe : Daily
There is also a Japanese candlestick pattern detected by Central Candlesticks that could mark the end of the current short-term trend:
Doji
Type : Neutral
Timeframe : Daily
| S3 | S2 | S1 | Price | R1 | R2 | R3 | |
|---|---|---|---|---|---|---|---|
| ProTrendLines | 1,485.00 | 1,500.00 | 1,520.00 | 1,530.00 | 1,564.50 | 1,662.33 | 1,741.00 |
| Change (%) | -2.94% | -1.96% | -0.65% | - | +2.25% | +8.65% | +13.79% |
| Change | -45.00 | -30.00 | -10.00 | - | +34.50 | +132.33 | +211.00 |
| Level | Major | Intermediate | Minor | - | Major | Minor | Minor |
Pivot points can also be used to set your price objectives. Here is the price situation in relation to pivot points:
| Pivot points | S3 | S2 | S1 | PP | R1 | R2 | R3 |
|---|---|---|---|---|---|---|---|
| Standard | 1,475.00 | 1,490.00 | 1,505.00 | 1,520.00 | 1,535.00 | 1,550.00 | 1,565.00 |
| Camarilla | 1,511.75 | 1,514.50 | 1,517.25 | 1,520.00 | 1,522.75 | 1,525.50 | 1,528.25 |
| Woodie | 1,475.00 | 1,490.00 | 1,505.00 | 1,520.00 | 1,535.00 | 1,550.00 | 1,565.00 |
| Fibonacci | 1,490.00 | 1,501.46 | 1,508.54 | 1,520.00 | 1,531.46 | 1,538.54 | 1,550.00 |
| Pivot points | S3 | S2 | S1 | PP | R1 | R2 | R3 |
|---|---|---|---|---|---|---|---|
| Standard | 1,465.00 | 1,475.00 | 1,495.00 | 1,505.00 | 1,525.00 | 1,535.00 | 1,555.00 |
| Camarilla | 1,506.75 | 1,509.50 | 1,512.25 | 1,515.00 | 1,517.75 | 1,520.50 | 1,523.25 |
| Woodie | 1,470.00 | 1,477.50 | 1,500.00 | 1,507.50 | 1,530.00 | 1,537.50 | 1,560.00 |
| Fibonacci | 1,475.00 | 1,486.46 | 1,493.54 | 1,505.00 | 1,516.46 | 1,523.54 | 1,535.00 |
| Pivot points | S3 | S2 | S1 | PP | R1 | R2 | R3 |
|---|---|---|---|---|---|---|---|
| Standard | 1,426.67 | 1,438.33 | 1,461.67 | 1,473.33 | 1,496.67 | 1,508.33 | 1,531.67 |
| Camarilla | 1,475.38 | 1,478.58 | 1,481.79 | 1,485.00 | 1,488.21 | 1,491.42 | 1,494.63 |
| Woodie | 1,432.50 | 1,441.25 | 1,467.50 | 1,476.25 | 1,502.50 | 1,511.25 | 1,537.50 |
| Fibonacci | 1,438.33 | 1,451.70 | 1,459.96 | 1,473.33 | 1,486.70 | 1,494.96 | 1,508.33 |
Numerical data
The following is the status of technical indicators and moving averages registered at the time this technical analysis was created:
| RSI (14): | 61.59 | |
| MACD (12,26,9): | 10.2700 | |
| Directional Movement: | 11.27 | |
| AROON (14): | 78.57 | |
| DEMA (21): | 1,515.16 | |
| Parabolic SAR (0,02-0,02-0,2): | 1,503.70 | |
| Elder Ray (13): | 14.49 | |
| Super Trend (3,10): | 1,477.18 | |
| Zig ZAG (10): | 1,515.00 | |
| VORTEX (21): | 1.0800 | |
| Stochastique (14,3,5): | 80.56 | |
| TEMA (21): | 1,520.11 | |
| Williams %R (14): | -33.33 | |
| Chande Momentum Oscillator (20): | 40.00 | |
| Repulse (5,40,3): | 0.1500 | |
| ROCnROLL: | 1 | |
| TRIX (15,9): | 0.0800 | |
| Courbe Coppock: | 3.50 |
| MA7: | 1,516.43 | |
| MA20: | 1,499.50 | |
| MA50: | 1,484.20 | |
| MA100: | 1,477.20 | |
| MAexp7: | 1,513.99 | |
| MAexp20: | 1,502.43 | |
| MAexp50: | 1,489.06 | |
| MAexp100: | 1,478.96 | |
| Price / MA7: | +0.89% | |
| Price / MA20: | +2.03% | |
| Price / MA50: | +3.09% | |
| Price / MA100: | +3.57% | |
| Price / MAexp7: | +1.06% | |
| Price / MAexp20: | +1.84% | |
| Price / MAexp50: | +2.75% | |
| Price / MAexp100: | +3.45% |
About author

Online


Add a comment
Comments
0 comments on the analysis GRAUB KB PS - Daily