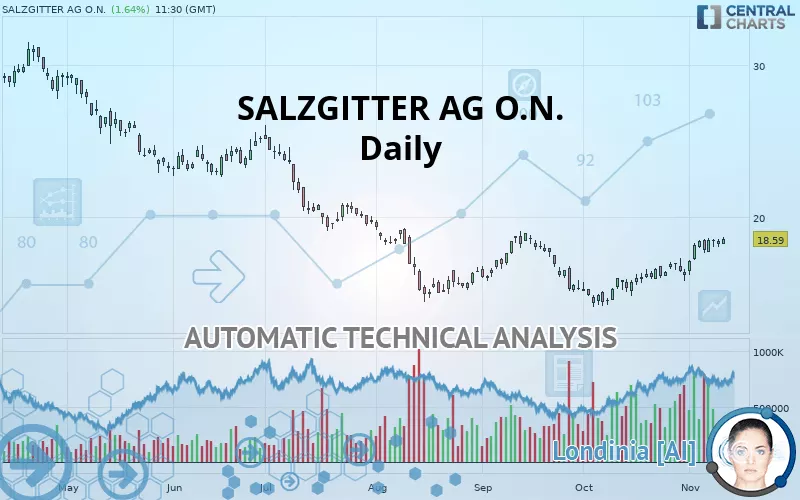
SALZGITTER AG O.N. - Daily - Technical analysis published on 11/12/2019 (GMT)
- 279
- 0
- Who voted?
Click here for a new analysis!
- Timeframe : Daily
- - Analysis generated on
- Status : TARGET REACHED

Summary of the analysis

Additional analysis
Quotes
The SALZGITTER AG O.N. rating is 18.590 EUR. The price has increased by +1.64% since the last closing with the lowest point at 18.290 EUR and the highest point at 18.690 EUR. The deviation from the price is +1.64% for the low point and -0.54% for the high point.Here is a more detailed summary of the historical variations registered by SALZGITTER AG O.N.:
Technical
Technical analysis of this Daily chart of SALZGITTER AG O.N. indicates that the overall trend is bullish. 67.86% of the signals given by moving averages are bullish. The overall trend is reinforced by the strong bullish signals from short-term moving averages. There is no crossing of moving average by the price or crossing of moving averages between themselves.
Technical indicators are strongly bullish, suggesting that the price increase should continue.
But beware of excesses. The Central Indicators scanner currently detects this:
CCI indicator is overbought : over 100
Type : Neutral
Timeframe : Daily
Williams %R indicator is overbought : over -20
Type : Neutral
Timeframe : Daily
Pivot points : price is over resistance 1
Type : Neutral
Timeframe : Daily
Price is back over the pivot point
Type : Bullish
Timeframe : Weekly
Price is back under the pivot point
Type : Bearish
Timeframe : Daily
An analysis of the price chart with the Central Patterns scanner (detector of chart patterns and resistances and supports) shows several results that can have an impact on the price change:
Near resistance of channel
Type : Bearish
Timeframe : Daily
Resistance of triangle is broken
Type : Bullish
Timeframe : Daily
The Central Candlesticks scanner which studies Japanese candlesticks did not detect anything.
| S2 | S1 | Price | R1 | R2 | R3 | |
|---|---|---|---|---|---|---|
| ProTrendLines | 14.965 | 17.100 | 18.590 | 19.005 | 23.583 | 25.460 |
| Change (%) | -19.50% | -8.02% | - | +2.23% | +26.86% | +36.96% |
| Change | -3.625 | -1.490 | - | +0.415 | +4.993 | +6.870 |
| Level | Major | Intermediate | - | Minor | Minor | Intermediate |
To determine price objectives, it is also possible to use the pivot points. Here is the price position in relation to pivot points:
| Pivot points | S3 | S2 | S1 | PP | R1 | R2 | R3 |
|---|---|---|---|---|---|---|---|
| Standard | 17.495 | 17.770 | 18.030 | 18.305 | 18.565 | 18.840 | 19.100 |
| Camarilla | 18.143 | 18.192 | 18.241 | 18.290 | 18.339 | 18.388 | 18.437 |
| Woodie | 17.488 | 17.766 | 18.023 | 18.301 | 18.558 | 18.836 | 19.093 |
| Fibonacci | 17.770 | 17.974 | 18.101 | 18.305 | 18.509 | 18.636 | 18.840 |
| Pivot points | S3 | S2 | S1 | PP | R1 | R2 | R3 |
|---|---|---|---|---|---|---|---|
| Standard | 16.213 | 16.712 | 17.633 | 18.132 | 19.053 | 19.552 | 20.473 |
| Camarilla | 18.165 | 18.295 | 18.425 | 18.555 | 18.685 | 18.815 | 18.946 |
| Woodie | 16.425 | 16.818 | 17.845 | 18.238 | 19.265 | 19.658 | 20.685 |
| Fibonacci | 16.712 | 17.254 | 17.589 | 18.132 | 18.674 | 19.009 | 19.552 |
| Pivot points | S3 | S2 | S1 | PP | R1 | R2 | R3 |
|---|---|---|---|---|---|---|---|
| Standard | 11.223 | 12.677 | 14.453 | 15.907 | 17.683 | 19.137 | 20.913 |
| Camarilla | 15.342 | 15.638 | 15.934 | 16.230 | 16.526 | 16.822 | 17.118 |
| Woodie | 11.385 | 12.758 | 14.615 | 15.988 | 17.845 | 19.218 | 21.075 |
| Fibonacci | 12.677 | 13.911 | 14.673 | 15.907 | 17.141 | 17.903 | 19.137 |
Numerical data
The following are the details of the technical indicators and moving averages that were collected to generate this technical analysis:
| RSI (14): | 63.78 | |
| MACD (12,26,9): | 0.6220 | |
| Directional Movement: | 13.902 | |
| AROON (14): | 57.143 | |
| DEMA (21): | 18.050 | |
| Parabolic SAR (0,02-0,02-0,2): | 16.687 | |
| Elder Ray (13): | 0.762 | |
| Super Trend (3,10): | 16.395 | |
| Zig ZAG (10): | 18.595 | |
| VORTEX (21): | 1.1860 | |
| Stochastique (14,3,5): | 93.80 | |
| TEMA (21): | 18.679 | |
| Williams %R (14): | -3.83 | |
| Chande Momentum Oscillator (20): | 2.145 | |
| Repulse (5,40,3): | 3.9420 | |
| ROCnROLL: | 1 | |
| TRIX (15,9): | 0.3670 | |
| Courbe Coppock: | 24.39 |
| MA7: | 18.366 | |
| MA20: | 17.096 | |
| MA50: | 16.760 | |
| MA100: | 18.130 | |
| MAexp7: | 18.184 | |
| MAexp20: | 17.364 | |
| MAexp50: | 17.175 | |
| MAexp100: | 18.550 | |
| Price / MA7: | +1.22% | |
| Price / MA20: | +8.74% | |
| Price / MA50: | +10.92% | |
| Price / MA100: | +2.54% | |
| Price / MAexp7: | +2.23% | |
| Price / MAexp20: | +7.06% | |
| Price / MAexp50: | +8.24% | |
| Price / MAexp100: | +0.22% |
News
Don"t forget to follow the news on SALZGITTER AG O.N.. At the time of publication of this analysis, the latest news was as follows:
- DGAP-Adhoc: Salzgitter AG: Salzgitter Group delivers positive nine-month result
- DGAP-Adhoc: Salzgitter AG: Salzgitter Group adjusts its earnings forecast for the financial year 2019 due to risk provisioning
- DGAP-News: Salzgitter AG: Salzgitter Group generates a pre-tax profit of EUR 145 million in the first half year
- DGAP-News: Salzgitter AG: Salzgitter AG builds new hot dip galvanizing line
- DGAP-Adhoc: Salzgitter AG: Medium-term shortfall in CO2 allowances has been compensated for the most part at the subsidiaries of the Salzgitter Group; current market value of allowances purchased exceeds figure accounted for in the balance sheet by around EUR 300 m
About author

Online


Add a comment
Comments
0 comments on the analysis SALZGITTER AG O.N. - Daily