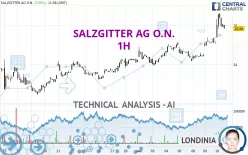
SALZGITTER AG O.N. - 1H - Technical analysis published on 04/10/2024 (GMT)
- 118
- 0
Click here for a new analysis!
- Timeframe : 1H
- - Analysis generated on
- Status : INVALID

Summary of the analysis

Additional analysis
Quotes
The SALZGITTER AG O.N. rating is 26.06 EUR. The price registered an increase of +3.83% on the session and was traded between 25.40 EUR and 26.64 EUR over the period. The price is currently at +2.60% from its lowest and -2.18% from its highest.The Central Gaps scanner detects a bullish opening marking the presence of buyers ahead of sellers at the opening but not sufficiently marked to allow the price to register a quotation gap.
Bullish opening
Type : Bullish
Timeframe : Openning
Here is a more detailed summary of the historical variations registered by SALZGITTER AG O.N.:
New HIGH record (1 month)
Type : Bullish
Timeframe : Weekly
Technical
A technical analysis in 1H of this SALZGITTER AG O.N. chart shows a strongly bullish trend. The signals given by the moving averages are 92.86% bullish. This strong bullish trend is confirmed by the strong signals currently being given by short-term moving averages. There is no crossing of moving average by the price or crossing of moving averages between themselves.
The probability of a further increase is high given the direction of the technical indicators.
Caution: the Central Indicators scanner currently detects an excess:
CCI indicator is overbought : over 100
Type : Neutral
Timeframe : 1 hour
Pivot points : price is over resistance 2
Type : Neutral
Timeframe : 1 hour
Pivot points : price is over resistance 3
Type : Neutral
Timeframe : Weekly
The Central Patterns scanner, which studies chart patterns, resistances and supports, has identified this signal:
Resistance of channel is broken
Type : Bullish
Timeframe : 1 hour
The Central Candlesticks scanner which studies Japanese candlesticks did not detect anything.
| S3 | S2 | S1 | Price | R1 | R2 | R3 | |
|---|---|---|---|---|---|---|---|
| ProTrendLines | 23.98 | 24.99 | 25.40 | 26.06 | 26.15 | 29.33 | 31.50 |
| Change (%) | -7.98% | -4.11% | -2.53% | - | +0.35% | +12.55% | +20.87% |
| Change | -2.08 | -1.07 | -0.66 | - | +0.09 | +3.27 | +5.44 |
| Level | Major | Intermediate | Minor | - | Intermediate | Intermediate | Minor |
Attention could also be paid to pivot points to set price objectives:
| Pivot points | S3 | S2 | S1 | PP | R1 | R2 | R3 |
|---|---|---|---|---|---|---|---|
| Standard | 23.73 | 24.13 | 24.61 | 25.01 | 25.49 | 25.89 | 26.37 |
| Camarilla | 24.86 | 24.94 | 25.02 | 25.10 | 25.18 | 25.26 | 25.34 |
| Woodie | 23.78 | 24.15 | 24.66 | 25.03 | 25.54 | 25.91 | 26.42 |
| Fibonacci | 24.13 | 24.46 | 24.67 | 25.01 | 25.34 | 25.55 | 25.89 |
| Pivot points | S3 | S2 | S1 | PP | R1 | R2 | R3 |
|---|---|---|---|---|---|---|---|
| Standard | 22.53 | 23.23 | 23.71 | 24.41 | 24.89 | 25.59 | 26.07 |
| Camarilla | 23.86 | 23.96 | 24.07 | 24.18 | 24.29 | 24.40 | 24.51 |
| Woodie | 22.41 | 23.18 | 23.59 | 24.36 | 24.77 | 25.54 | 25.95 |
| Fibonacci | 23.23 | 23.68 | 23.96 | 24.41 | 24.86 | 25.14 | 25.59 |
| Pivot points | S3 | S2 | S1 | PP | R1 | R2 | R3 |
|---|---|---|---|---|---|---|---|
| Standard | 21.10 | 21.76 | 22.98 | 23.64 | 24.86 | 25.52 | 26.74 |
| Camarilla | 23.68 | 23.86 | 24.03 | 24.20 | 24.37 | 24.55 | 24.72 |
| Woodie | 21.38 | 21.90 | 23.26 | 23.78 | 25.14 | 25.66 | 27.02 |
| Fibonacci | 21.76 | 22.48 | 22.92 | 23.64 | 24.36 | 24.80 | 25.52 |
Numerical data
The following is the status of technical indicators and moving averages registered at the time this technical analysis was created:
| RSI (14): | 65.88 | |
| MACD (12,26,9): | 0.4100 | |
| Directional Movement: | 28.26 | |
| AROON (14): | 85.71 | |
| DEMA (21): | 25.87 | |
| Parabolic SAR (0,02-0,02-0,2): | 25.51 | |
| Elder Ray (13): | 0.38 | |
| Super Trend (3,10): | 25.52 | |
| Zig ZAG (10): | 26.06 | |
| VORTEX (21): | 1.2100 | |
| Stochastique (14,3,5): | 77.72 | |
| TEMA (21): | 26.13 | |
| Williams %R (14): | -27.36 | |
| Chande Momentum Oscillator (20): | 1.08 | |
| Repulse (5,40,3): | 0.1900 | |
| ROCnROLL: | 1 | |
| TRIX (15,9): | 0.1600 | |
| Courbe Coppock: | 10.71 |
| MA7: | 24.83 | |
| MA20: | 24.07 | |
| MA50: | 24.45 | |
| MA100: | 25.77 | |
| MAexp7: | 25.91 | |
| MAexp20: | 25.39 | |
| MAexp50: | 24.91 | |
| MAexp100: | 24.50 | |
| Price / MA7: | +4.95% | |
| Price / MA20: | +8.27% | |
| Price / MA50: | +6.58% | |
| Price / MA100: | +1.13% | |
| Price / MAexp7: | +0.58% | |
| Price / MAexp20: | +2.64% | |
| Price / MAexp50: | +4.62% | |
| Price / MAexp100: | +6.37% |
News
The last news published on SALZGITTER AG O.N. at the time of the generation of this analysis was as follows:
- EQS-News: Salzgitter AG: Diversification paying off – satisfactory result despite increasingly difficult market environment
- EQS-News: Salzgitter AG sells Mannesmann Stainless Tubes Group to Cogne Acciai Speciali
- EQS-News: Supervisory Board of Salzgitter AG extends Gunnar Groebler's contract
- EQS-News: Sale of Borusan Mannesmann participation concluded
- EQS-News: Salzgitter AG generates presentable nine-month result despite economic headwind
About author
Online


Add a comment
Comments
0 comments on the analysis SALZGITTER AG O.N. - 1H