| Open: | - |
| Change: | - |
| Volume: | - |
| Low: | - |
| High: | - |
| High / Low range: | - |
| Type: | Stocks |
| Ticker: | KWS |
| ISIN: | DE0007074007 |
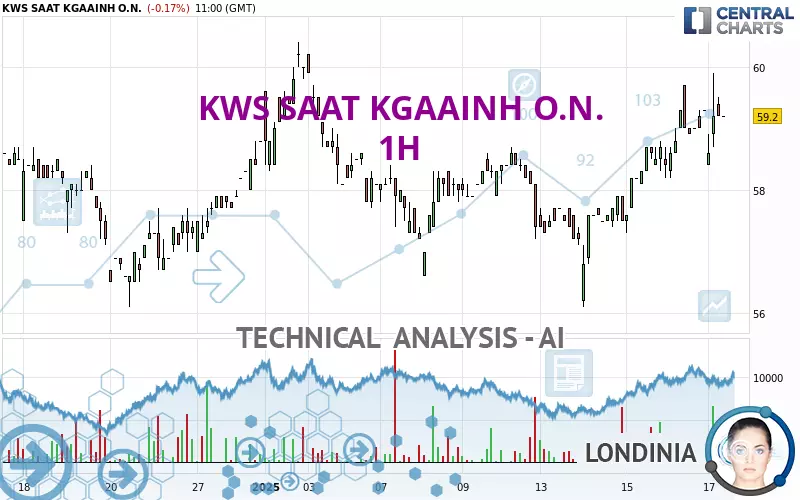
KWS SAAT KGAAINH O.N. - 1H - Technical analysis published on 01/17/2025 (GMT)
- 77
- 0
- 01/17/2025 - 11:20
Click here for a new analysis!
- Timeframe : 1H
- - Analysis generated on 01/17/2025 - 11:20
- Status : TARGET REACHED
Summary of the analysis

Additional analysis
Quotes
The KWS SAAT KGAAINH O.N. rating is 59.2 EUR. On the day, this instrument lost -0.17% and was traded between 58.4 EUR and 59.9 EUR over the period. The price is currently at +1.37% from its lowest and -1.17% from its highest.The Central Gaps scanner detects a bearish opening. A small advantage for sellers in the very short term.
Bearish opening
Type : Bearish
Timeframe : Openning
A study of price movements over other periods shows the following variations:
Near a new LOW record (1st january)
Type : Bearish
Timeframe : Weekly
Near a new LOW record (1 month)
Type : Bearish
Timeframe : Weekly
Technical
A technical analysis in 1H of this KWS SAAT KGAAINH O.N. chart shows a strongly bullish trend. 89.29% of the signals given by moving averages are bullish. The overall trend is supported by the strong bullish signals from short-term moving averages. The Central Indicators scanner does not detect any result on moving averages that would impact this trend.
In fact, according to the parameters integrated into the Central Analyzer system, 12 technical indicators out of 18 analysed are currently bullish. Caution: the Central Indicators scanner currently detects an excess:
CCI indicator is overbought : over 100
Type : Neutral
Timeframe : 1 hour
Pivot points : price is over resistance 1
Type : Neutral
Timeframe : Weekly
The Central Patterns scanner, which studies chart patterns, resistances and supports, has identified this signal:
Near horizontal support
Type : Bullish
Timeframe : 1 hour
The Central Candlesticks scanner which studies Japanese candlesticks did not detect anything.
| S3 | S2 | S1 | Price | R1 | R2 | R3 | |
|---|---|---|---|---|---|---|---|
| ProTrendLines | 56.8 | 57.7 | 58.7 | 59.2 | 60.0 | 60.4 | 61.7 |
| Change (%) | -4.05% | -2.53% | -0.84% | - | +1.35% | +2.03% | +4.22% |
| Change | -2.4 | -1.5 | -0.5 | - | +0.8 | +1.2 | +2.5 |
| Level | Major | Minor | Intermediate | - | Major | Intermediate | Major |
Attention could also be paid to pivot points to set price objectives:
| Pivot points | S3 | S2 | S1 | PP | R1 | R2 | R3 |
|---|---|---|---|---|---|---|---|
| Standard | 56.9 | 57.6 | 58.4 | 59.1 | 59.9 | 60.6 | 61.4 |
| Camarilla | 58.9 | 59.0 | 59.2 | 59.3 | 59.4 | 59.6 | 59.7 |
| Woodie | 57.1 | 57.6 | 58.6 | 59.1 | 60.1 | 60.6 | 61.6 |
| Fibonacci | 57.6 | 58.1 | 58.5 | 59.1 | 59.6 | 60.0 | 60.6 |
| Pivot points | S3 | S2 | S1 | PP | R1 | R2 | R3 |
|---|---|---|---|---|---|---|---|
| Standard | 54.1 | 55.3 | 56.4 | 57.6 | 58.7 | 59.9 | 61.0 |
| Camarilla | 56.8 | 57.0 | 57.2 | 57.4 | 57.6 | 57.8 | 58.0 |
| Woodie | 54.0 | 55.3 | 56.3 | 57.6 | 58.6 | 59.9 | 60.9 |
| Fibonacci | 55.3 | 56.2 | 56.8 | 57.6 | 58.5 | 59.1 | 59.9 |
| Pivot points | S3 | S2 | S1 | PP | R1 | R2 | R3 |
|---|---|---|---|---|---|---|---|
| Standard | 52.2 | 54.1 | 56.5 | 58.4 | 60.8 | 62.7 | 65.1 |
| Camarilla | 57.6 | 58.0 | 58.4 | 58.8 | 59.2 | 59.6 | 60.0 |
| Woodie | 52.4 | 54.2 | 56.7 | 58.5 | 61.0 | 62.8 | 65.3 |
| Fibonacci | 54.1 | 55.8 | 56.8 | 58.4 | 60.1 | 61.1 | 62.7 |
Numerical data
The following are the details of the technical indicators and moving averages that were collected to generate this technical analysis:
| RSI (14): | 59.90 | |
| MACD (12,26,9): | 0.3000 | |
| Directional Movement: | 17.2 | |
| AROON (14): | 71.5 | |
| DEMA (21): | 59.2 | |
| Parabolic SAR (0,02-0,02-0,2): | 58.4 | |
| Elder Ray (13): | 0.5 | |
| Super Trend (3,10): | 58.3 | |
| Zig ZAG (10): | 59.5 | |
| VORTEX (21): | 1.1000 | |
| Stochastique (14,3,5): | 54.00 | |
| TEMA (21): | 59.4 | |
| Williams %R (14): | -23.50 | |
| Chande Momentum Oscillator (20): | 0.8 | |
| Repulse (5,40,3): | 0.3000 | |
| ROCnROLL: | 1 | |
| TRIX (15,9): | 0.1000 | |
| Courbe Coppock: | 2.70 |
| MA7: | 58.3 | |
| MA20: | 58.2 | |
| MA50: | 58.6 | |
| MA100: | 61.2 | |
| MAexp7: | 59.1 | |
| MAexp20: | 58.7 | |
| MAexp50: | 58.3 | |
| MAexp100: | 58.2 | |
| Price / MA7: | +1.54% | |
| Price / MA20: | +1.72% | |
| Price / MA50: | +1.02% | |
| Price / MA100: | -3.27% | |
| Price / MAexp7: | +0.17% | |
| Price / MAexp20: | +0.85% | |
| Price / MAexp50: | +1.54% | |
| Price / MAexp100: | +1.72% |
News
Don't forget to follow the news on KWS SAAT KGAAINH O.N.. At the time of publication of this analysis, the latest news was as follows:
- 12/05/2024 - 14:00 EQS-News: KWS Annual Shareholders’ Meeting approves dividend of €1.00 and elects Dr. Hagen Duenbostel to the Supervisory Board
- 11/12/2024 - 06:00 EQS-News: KWS publishes results for the first quarter 2024/2025 and confirms forecast
- 11/05/2024 - 09:00 EQS-News: Future KWS Executive Board team is finalized – Dr. Jörn Andreas and Sebastian Talg appointed
- 09/26/2024 - 05:00 EQS-News: KWS closes strong fiscal year 2023/2024 and increases dividend
- 08/16/2024 - 08:31 EQS-Adhoc: KWS SAAT SE & Co. KGaA: Based on preliminary key figures, KWS significantly exceeds forecasts for fiscal year 2023/2024 and publishes outlook for fiscal year 2024/2025
About author
Online


Add a comment
Comments
0 comments on the analysis KWS SAAT KGAAINH O.N. - 1H