| Open: | 84,354.22 |
| Change: | -283.79 |
| Volume: | 10,233 |
| Low: | 83,767.52 |
| High: | 84,386.91 |
| High / Low range: | 619.39 |
| Type: | Stocks |
| Ticker: | KWS |
| ISIN: | DE0007074007 |
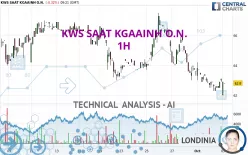
KWS SAAT KGAAINH O.N. - 1H - Technical analysis published on 10/03/2024 (GMT)
- 119
- 0
- 10/03/2024 - 10:30
Click here for a new analysis!
- Timeframe : 1H
- - Analysis generated on 10/03/2024 - 10:30
- Status : INVALID

Summary of the analysis

Additional analysis
Quotes
KWS SAAT KGAAINH O.N. rating 62.8 EUR. On the day, this instrument lost -0.32% and was traded between 62.0 EUR and 62.9 EUR over the period. The price is currently at +1.29% from its lowest and -0.16% from its highest.The Central Gaps scanner detects the formation of a bearish gap marking the strong presence of sellers ahead of buyers at the opening. This formed a quotation gap.
Opening Gap DOWN
Type : Bearish
Timeframe : Openning
A study of price movements over other periods shows the following variations:
New LOW record (1 month)
Type : Bearish
Timeframe : Weekly
Technical
A technical analysis in 1H of this KWS SAAT KGAAINH O.N. chart shows a sharp bearish trend. 92.86% of the signals given by moving averages are bearish. This strongly bearish trend is supported by the strong bearish signals given by short-term moving averages. The Central Indicators market scanner currently does not detect any result that concerns moving averages.
On the 18 technical indicators analysed, 7 are bullish, 5 are neutral and 6 are bearish. The Central Indicators scanner found this result concerning these indicators:
Pivot points : price is under support 1
Type : Neutral
Timeframe : Weekly
An analysis of the price chart with the Central Patterns scanner (detector of chart patterns and resistances and supports) shows several results that can have an impact on the price change:
Near horizontal support
Type : Bullish
Timeframe : 1 hour
Near support of channel
Type : Bullish
Timeframe : 1 hour
The presence of these Japanese chandelier patterns detected by Central Candlesticks that could impact the current short-term trend were also noted:
Doji
Type : Neutral
Timeframe : 1 hour
Bearish harami cross
Type : Bearish
Timeframe : 1 hour
| S3 | S2 | S1 | Price | R1 | R2 | R3 | |
|---|---|---|---|---|---|---|---|
| ProTrendLines | 53.3 | 59.4 | 62.7 | 62.8 | 64.0 | 66.0 | 67.0 |
| Change (%) | -15.13% | -5.41% | -0.16% | - | +1.91% | +5.10% | +6.69% |
| Change | -9.5 | -3.4 | -0.1 | - | +1.2 | +3.2 | +4.2 |
| Level | Intermediate | Minor | Major | - | Intermediate | Minor | Major |
Attention could also be paid to pivot points to set price objectives:
| Pivot points | S3 | S2 | S1 | PP | R1 | R2 | R3 |
|---|---|---|---|---|---|---|---|
| Standard | 61.7 | 62.0 | 62.5 | 62.8 | 63.3 | 63.6 | 64.1 |
| Camarilla | 62.8 | 62.9 | 62.9 | 63.0 | 63.1 | 63.2 | 63.2 |
| Woodie | 61.8 | 62.1 | 62.6 | 62.9 | 63.4 | 63.7 | 64.2 |
| Fibonacci | 62.0 | 62.3 | 62.5 | 62.8 | 63.1 | 63.3 | 63.6 |
| Pivot points | S3 | S2 | S1 | PP | R1 | R2 | R3 |
|---|---|---|---|---|---|---|---|
| Standard | 59.6 | 61.6 | 63.6 | 65.6 | 67.6 | 69.6 | 71.6 |
| Camarilla | 64.6 | 65.0 | 65.3 | 65.7 | 66.1 | 66.4 | 66.8 |
| Woodie | 59.7 | 61.6 | 63.7 | 65.6 | 67.7 | 69.6 | 71.7 |
| Fibonacci | 61.6 | 63.1 | 64.0 | 65.6 | 67.1 | 68.0 | 69.6 |
| Pivot points | S3 | S2 | S1 | PP | R1 | R2 | R3 |
|---|---|---|---|---|---|---|---|
| Standard | 56.6 | 59.8 | 61.7 | 64.9 | 66.8 | 70.0 | 71.9 |
| Camarilla | 62.2 | 62.7 | 63.1 | 63.6 | 64.1 | 64.5 | 65.0 |
| Woodie | 56.0 | 59.5 | 61.1 | 64.6 | 66.2 | 69.7 | 71.3 |
| Fibonacci | 59.8 | 61.8 | 63.0 | 64.9 | 66.9 | 68.1 | 70.0 |
Numerical data
The following is the status of the technical indicators and moving averages at the time of publication of this technical analysis:
| RSI (14): | 40.50 | |
| MACD (12,26,9): | -0.4000 | |
| Directional Movement: | -26.7 | |
| AROON (14): | -85.8 | |
| DEMA (21): | 62.5 | |
| Parabolic SAR (0,02-0,02-0,2): | 63.1 | |
| Elder Ray (13): | -0.1 | |
| Super Trend (3,10): | 63.6 | |
| Zig ZAG (10): | 62.8 | |
| VORTEX (21): | 0.9000 | |
| Stochastique (14,3,5): | 61.70 | |
| TEMA (21): | 62.5 | |
| Williams %R (14): | -42.90 | |
| Chande Momentum Oscillator (20): | -0.3 | |
| Repulse (5,40,3): | 1.5000 | |
| ROCnROLL: | 2 | |
| TRIX (15,9): | -0.1000 | |
| Courbe Coppock: | 1.80 |
| MA7: | 64.1 | |
| MA20: | 64.9 | |
| MA50: | 65.3 | |
| MA100: | 63.1 | |
| MAexp7: | 62.8 | |
| MAexp20: | 63.1 | |
| MAexp50: | 63.8 | |
| MAexp100: | 64.5 | |
| Price / MA7: | -2.03% | |
| Price / MA20: | -3.24% | |
| Price / MA50: | -3.83% | |
| Price / MA100: | -0.48% | |
| Price / MAexp7: | -0% | |
| Price / MAexp20: | -0.48% | |
| Price / MAexp50: | -1.57% | |
| Price / MAexp100: | -2.64% |
News
The last news published on KWS SAAT KGAAINH O.N. at the time of the generation of this analysis was as follows:
- 09/26/2024 - 05:00 EQS-News: KWS closes strong fiscal year 2023/2024 and increases dividend
- 08/16/2024 - 08:31 EQS-Adhoc: KWS SAAT SE & Co. KGaA: Based on preliminary key figures, KWS significantly exceeds forecasts for fiscal year 2023/2024 and publishes outlook for fiscal year 2024/2025
- 08/02/2024 - 08:00 EQS-News: KWS closes sale of corn business in South America
- 05/14/2024 - 05:00 EQS-News: KWS reports significant growth in sales and earnings for the first nine months of 2023/2024
- 04/30/2024 - 09:51 EQS-Adhoc: KWS SAAT SE & Co. KGaA: Preliminary figures show significant growth in sales and EBIT for first nine months 2023/2024 – full-year forecasts raised
About author
Online


Add a comment
Comments
0 comments on the analysis KWS SAAT KGAAINH O.N. - 1H