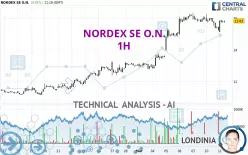
NORDEX SE O.N. - 1H - Technical analysis published on 03/11/2025 (GMT)
- 79
- 0
Click here for a new analysis!
- Timeframe : 1H
- - Analysis generated on
- Status : INVALID

Summary of the analysis

Additional analysis
Quotes
The NORDEX SE O.N. price is 15.83 EUR. The price registered an increase of +4.01% on the session with the lowest point at 15.13 EUR and the highest point at 15.88 EUR. The deviation from the price is +4.63% for the low point and -0.31% for the high point.A bearish gap was detected at the opening by the Central Gaps scanner. There are a lot of sellers and they have the upper hand in the very short term.
Opening Gap DOWN
Type : Bearish
Timeframe : Openning
Here is a more detailed summary of the historical variations registered by NORDEX SE O.N.:
Near a new HIGH record (1 year)
Type : Bullish
Timeframe : Weekly
Near a new HIGH record (1st january)
Type : Bullish
Timeframe : Weekly
Near a new HIGH record (1 month)
Type : Bullish
Timeframe : Weekly
The Central Volumes scanner detects abnormal volumes on the asset:
Abnormal volumes
Timeframe : 5 days
Technical
Technical analysis of this 1H chart of NORDEX SE O.N. indicates that the overall trend is strongly bullish. The signals given by moving averages are 89.29% bullish. This strongly bullish trend seems to be running out of steam given the signals being given by short-term moving averages. An assessment of moving averages reveals several bearish and bullish signals:
Bullish price crossover with Moving Average 20
Type : Bullish
Timeframe : 1 hour
Bearish price crossover with adaptative moving average 20
Type : Bearish
Timeframe : 1 hour
An assessment of technical indicators does not currently provide any relevant information to suggest whether the signal given by the technical indicators is more bullish or bearish.
The Central Indicators scanner found no further results concerning independent technical indicators.
Central Patterns, the market scanner focusing on chart patterns, resistances and supports found this result:
Near support of channel
Type : Bullish
Timeframe : 1 hour
For a small rebound in the very short term, the Central Candlesticks scanner currently notes the presence of this bullish pattern in Japanese candlesticks:
Bullish doji star
Type : Bullish
Timeframe : 1 hour
| S3 | S2 | S1 | Price | R1 | R2 | R3 | |
|---|---|---|---|---|---|---|---|
| ProTrendLines | 13.09 | 14.04 | 15.44 | 15.83 | 16.55 | 17.96 | 20.66 |
| Change (%) | -17.31% | -11.31% | -2.46% | - | +4.55% | +13.46% | +30.51% |
| Change | -2.74 | -1.79 | -0.39 | - | +0.72 | +2.13 | +4.83 |
| Level | Intermediate | Intermediate | Major | - | Major | Intermediate | Minor |
To determine price objectives, it is also possible to use the pivot points. Here is the price position in relation to pivot points:
| Pivot points | S3 | S2 | S1 | PP | R1 | R2 | R3 |
|---|---|---|---|---|---|---|---|
| Standard | 13.86 | 14.54 | 14.88 | 15.56 | 15.90 | 16.58 | 16.92 |
| Camarilla | 14.94 | 15.03 | 15.13 | 15.22 | 15.31 | 15.41 | 15.50 |
| Woodie | 13.69 | 14.46 | 14.71 | 15.48 | 15.73 | 16.50 | 16.75 |
| Fibonacci | 14.54 | 14.93 | 15.17 | 15.56 | 15.95 | 16.19 | 16.58 |
| Pivot points | S3 | S2 | S1 | PP | R1 | R2 | R3 |
|---|---|---|---|---|---|---|---|
| Standard | 10.14 | 11.45 | 13.70 | 15.01 | 17.26 | 18.57 | 20.82 |
| Camarilla | 14.98 | 15.31 | 15.63 | 15.96 | 16.29 | 16.61 | 16.94 |
| Woodie | 10.62 | 11.69 | 14.18 | 15.25 | 17.74 | 18.81 | 21.30 |
| Fibonacci | 11.45 | 12.81 | 13.65 | 15.01 | 16.37 | 17.21 | 18.57 |
| Pivot points | S3 | S2 | S1 | PP | R1 | R2 | R3 |
|---|---|---|---|---|---|---|---|
| Standard | 8.77 | 9.70 | 11.38 | 12.31 | 13.99 | 14.92 | 16.60 |
| Camarilla | 12.33 | 12.57 | 12.81 | 13.05 | 13.29 | 13.53 | 13.77 |
| Woodie | 9.14 | 9.89 | 11.75 | 12.50 | 14.36 | 15.11 | 16.97 |
| Fibonacci | 9.70 | 10.70 | 11.32 | 12.31 | 13.31 | 13.93 | 14.92 |
Numerical data
The following is the status of technical indicators and moving averages registered at the time this technical analysis was created:
| RSI (14): | 54.70 | |
| MACD (12,26,9): | 0.0900 | |
| Directional Movement: | 7.78 | |
| AROON (14): | -64.28 | |
| DEMA (21): | 15.86 | |
| Parabolic SAR (0,02-0,02-0,2): | 15.87 | |
| Elder Ray (13): | 0.06 | |
| Super Trend (3,10): | 16.04 | |
| Zig ZAG (10): | 15.72 | |
| VORTEX (21): | 0.9700 | |
| Stochastique (14,3,5): | 56.16 | |
| TEMA (21): | 15.61 | |
| Williams %R (14): | -47.75 | |
| Chande Momentum Oscillator (20): | -0.09 | |
| Repulse (5,40,3): | 0.2300 | |
| ROCnROLL: | 1 | |
| TRIX (15,9): | 0.1400 | |
| Courbe Coppock: | 3.26 |
| MA7: | 14.97 | |
| MA20: | 12.99 | |
| MA50: | 12.14 | |
| MA100: | 12.15 | |
| MAexp7: | 15.69 | |
| MAexp20: | 15.68 | |
| MAexp50: | 15.15 | |
| MAexp100: | 14.26 | |
| Price / MA7: | +5.74% | |
| Price / MA20: | +21.86% | |
| Price / MA50: | +30.40% | |
| Price / MA100: | +30.29% | |
| Price / MAexp7: | +0.89% | |
| Price / MAexp20: | +0.96% | |
| Price / MAexp50: | +4.49% | |
| Price / MAexp100: | +11.01% |
News
The latest news and videos published on NORDEX SE O.N. at the time of the analysis were as follows:
- EQS-News: Nordex Group receives order in Brazil from Auren Energia for 112 MW
- EQS-News: Nordex Group achieves all 2024 financial and operational targets, reporting substantial increase in profitability
- EQS-News: Nordex Group with solid service success in 2024
- EQS-News: The Nordex Group announces leadership transition as CSO takes on new role within the company
- EQS-News: Nordex Group reaches new heights with its inhouse developed hybrid tower: The second N175/6.X has now been installed - for the first time with a hub height of 179 metres
About author
Online


Add a comment
Comments
0 comments on the analysis NORDEX SE O.N. - 1H