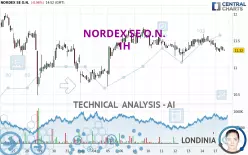
NORDEX SE O.N. - 1H - Technical analysis published on 02/17/2025 (GMT)
- 117
- 0
Click here for a new analysis!
- Timeframe : 1H
- - Analysis generated on
- Status : INVALID

Summary of the analysis

Additional analysis
Quotes
The NORDEX SE O.N. rating is 11.32 EUR. The price is lower by -0.96% since the last closing and was traded between 11.29 EUR and 11.46 EUR over the period. The price is currently at +0.27% from its lowest and -1.22% from its highest.The Central Gaps scanner detects a bullish opening. A small advantage for buyers in the very short term.
Bullish opening
Type : Bullish
Timeframe : Openning
So that you have an overall view of the price change, here is a table showing the variations over several periods:
Technical
Technical analysis of this 1H chart of NORDEX SE O.N. indicates that the overall trend is bearish. 67.86% of the signals given by moving averages are bearish. This bearish trend is supported by the strong bearish signals given by short-term moving averages. The Central Indicators market scanner is currently detecting a bullish signal that could impact this trend:
Bullish price crossover with Moving Average 100
Type : Bullish
Timeframe : 1 hour
In fact, 10 technical indicators on 18 studied are currently positioned bearish. Caution: the Central Indicators scanner currently detects an excess:
CCI indicator is oversold : under -100
Type : Neutral
Timeframe : 1 hour
Williams %R indicator is oversold : under -80
Type : Neutral
Timeframe : 1 hour
Pivot points : price is under support 1
Type : Neutral
Timeframe : 1 hour
Price is back under the pivot point
Type : Bearish
Timeframe : Weekly
Central Patterns, the market scanner focusing on chart patterns, resistances and supports found these results:
Near support of triangle
Type : Bullish
Timeframe : 1 hour
Support of channel is broken
Type : Bearish
Timeframe : 1 hour
The Central Candlesticks scanner which studies Japanese candlesticks did not detect anything.
| S3 | S2 | S1 | Price | R1 | R2 | R3 | |
|---|---|---|---|---|---|---|---|
| ProTrendLines | 10.39 | 10.71 | 11.06 | 11.32 | 11.44 | 11.75 | 12.48 |
| Change (%) | -8.22% | -5.39% | -2.30% | - | +1.06% | +3.80% | +10.25% |
| Change | -0.93 | -0.61 | -0.26 | - | +0.12 | +0.43 | +1.16 |
| Level | Intermediate | Minor | Major | - | Major | Major | Major |
Pivot points can also be used to set your price objectives. Here is the price situation in relation to pivot points:
| Pivot points | S3 | S2 | S1 | PP | R1 | R2 | R3 |
|---|---|---|---|---|---|---|---|
| Standard | 11.13 | 11.27 | 11.35 | 11.49 | 11.57 | 11.71 | 11.79 |
| Camarilla | 11.37 | 11.39 | 11.41 | 11.43 | 11.45 | 11.47 | 11.49 |
| Woodie | 11.10 | 11.26 | 11.32 | 11.48 | 11.54 | 11.70 | 11.76 |
| Fibonacci | 11.27 | 11.35 | 11.41 | 11.49 | 11.57 | 11.63 | 11.71 |
| Pivot points | S3 | S2 | S1 | PP | R1 | R2 | R3 |
|---|---|---|---|---|---|---|---|
| Standard | 10.56 | 10.83 | 11.13 | 11.40 | 11.70 | 11.97 | 12.27 |
| Camarilla | 11.27 | 11.33 | 11.38 | 11.43 | 11.48 | 11.54 | 11.59 |
| Woodie | 10.58 | 10.84 | 11.15 | 11.41 | 11.72 | 11.98 | 12.29 |
| Fibonacci | 10.83 | 11.05 | 11.18 | 11.40 | 11.62 | 11.75 | 11.97 |
| Pivot points | S3 | S2 | S1 | PP | R1 | R2 | R3 |
|---|---|---|---|---|---|---|---|
| Standard | 8.01 | 9.24 | 10.22 | 11.45 | 12.43 | 13.66 | 14.64 |
| Camarilla | 10.58 | 10.79 | 10.99 | 11.19 | 11.39 | 11.60 | 11.80 |
| Woodie | 7.88 | 9.18 | 10.09 | 11.39 | 12.30 | 13.60 | 14.51 |
| Fibonacci | 9.24 | 10.09 | 10.61 | 11.45 | 12.30 | 12.82 | 13.66 |
Numerical data
The following is the status of technical indicators and moving averages registered at the time this technical analysis was created:
| RSI (14): | 43.68 | |
| MACD (12,26,9): | -0.0300 | |
| Directional Movement: | -4.18 | |
| AROON (14): | -78.57 | |
| DEMA (21): | 11.38 | |
| Parabolic SAR (0,02-0,02-0,2): | 11.51 | |
| Elder Ray (13): | -0.07 | |
| Super Trend (3,10): | 11.23 | |
| Zig ZAG (10): | 11.32 | |
| VORTEX (21): | 0.9500 | |
| Stochastique (14,3,5): | 16.08 | |
| TEMA (21): | 11.34 | |
| Williams %R (14): | -90.00 | |
| Chande Momentum Oscillator (20): | -0.21 | |
| Repulse (5,40,3): | -0.5600 | |
| ROCnROLL: | 2 | |
| TRIX (15,9): | -0.0100 | |
| Courbe Coppock: | 2.58 |
| MA7: | 11.44 | |
| MA20: | 11.39 | |
| MA50: | 11.51 | |
| MA100: | 12.17 | |
| MAexp7: | 11.36 | |
| MAexp20: | 11.40 | |
| MAexp50: | 11.41 | |
| MAexp100: | 11.41 | |
| Price / MA7: | -1.05% | |
| Price / MA20: | -0.61% | |
| Price / MA50: | -1.65% | |
| Price / MA100: | -6.98% | |
| Price / MAexp7: | -0.35% | |
| Price / MAexp20: | -0.70% | |
| Price / MAexp50: | -0.79% | |
| Price / MAexp100: | -0.79% |
News
The latest news and videos published on NORDEX SE O.N. at the time of the analysis were as follows:
- EQS-News: Nordex Group with solid service success in 2024
- EQS-News: The Nordex Group announces leadership transition as CSO takes on new role within the company
- EQS-News: Nordex Group reaches new heights with its inhouse developed hybrid tower: The second N175/6.X has now been installed - for the first time with a hub height of 179 metres
- EQS-News: Nordex Group achieves record order intake of 8.3 GW in the fiscal year 2024
- EQS-News: Nordex Group receives orders for 638 MW from Türkiye in the 4th quarter and overachieves 1 GW order intake in 2024
About author
Online


Add a comment
Comments
0 comments on the analysis NORDEX SE O.N. - 1H