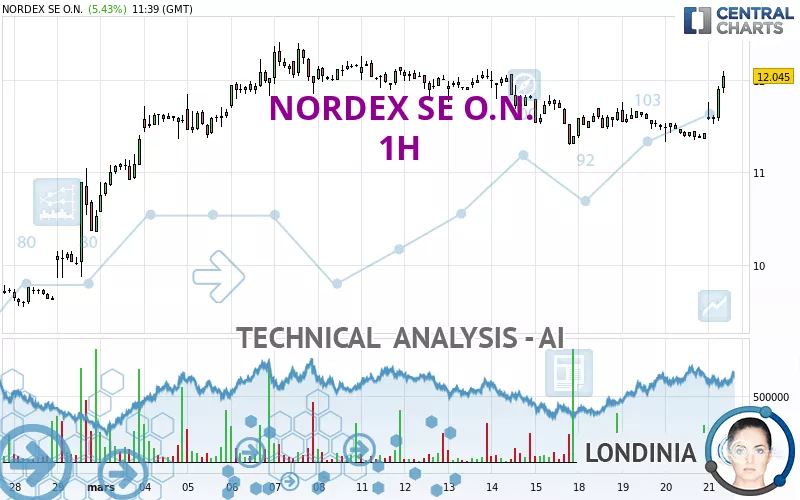
NORDEX SE O.N. - 1H - Technical analysis published on 03/21/2024 (GMT)
- 119
- 0
Click here for a new analysis!
- Timeframe : 1H
- - Analysis generated on
- Status : LEVEL MAINTAINED
Summary of the analysis

Additional analysis
Quotes
NORDEX SE O.N. rating 12.025 EUR. The price has increased by +5.25% since the last closing with the lowest point at 11.520 EUR and the highest point at 12.070 EUR. The deviation from the price is +4.38% for the low point and -0.37% for the high point.A bullish gap was detected at the opening by the Central Gaps scanner. There are a lot of buyers and they have the upper hand in the very short term.
Opening Gap UP
Type : Bullish
Timeframe : Openning
Here is a more detailed summary of the historical variations registered by NORDEX SE O.N.:
Technical
A technical analysis in 1H of this NORDEX SE O.N. chart shows a bullish trend. The signals returned by the moving averages are 71.43% bullish. This bullish trend is reinforced by the strong signals currently being given by short-term moving averages. An assessment of moving averages reveals several bullish signals that could impact this trend:
Bullish trend reversal : Moving Average 100
Type : Bullish
Timeframe : 1 hour
Bullish trend reversal : adaptative moving average 50
Type : Bullish
Timeframe : 1 hour
Technical indicators are strongly bullish, suggesting that the price increase should continue.
Caution: the Central Indicators scanner currently detects an excess:
RSI indicator is overbought : over 70
Type : Neutral
Timeframe : 1 hour
CCI indicator is overbought : over 100
Type : Neutral
Timeframe : 1 hour
Previous candle closed over Bollinger bands
Type : Neutral
Timeframe : 1 hour
Williams %R indicator is overbought : over -20
Type : Neutral
Timeframe : 1 hour
Pivot points : price is over resistance 3
Type : Neutral
Timeframe : 1 hour
MACD indicator is back over 0
Type : Bullish
Timeframe : 1 hour
Price is back over the pivot point
Type : Bullish
Timeframe : Weekly
An analysis of the price chart with the Central Patterns scanner (detector of chart patterns and resistances and supports) shows a result that can have an impact on the price change:
Resistance of channel is broken
Type : Bullish
Timeframe : 1 hour
No result was found by the Central Candlesticks scanner on Japanese candlesticks.
| S3 | S2 | S1 | Price | R1 | R2 | R3 | |
|---|---|---|---|---|---|---|---|
| ProTrendLines | 11.069 | 11.629 | 11.997 | 12.025 | 12.413 | 13.093 | 15.437 |
| Change (%) | -7.95% | -3.29% | -0.23% | - | +3.23% | +8.88% | +28.37% |
| Change | -0.956 | -0.396 | -0.028 | - | +0.388 | +1.068 | +3.412 |
| Level | Intermediate | Intermediate | Major | - | Intermediate | Major | Intermediate |
To determine price objectives, it is also possible to use the pivot points. Here is the price position in relation to pivot points:
| Pivot points | S3 | S2 | S1 | PP | R1 | R2 | R3 |
|---|---|---|---|---|---|---|---|
| Standard | 11.113 | 11.222 | 11.323 | 11.432 | 11.533 | 11.642 | 11.743 |
| Camarilla | 11.367 | 11.387 | 11.406 | 11.425 | 11.444 | 11.464 | 11.483 |
| Woodie | 11.110 | 11.220 | 11.320 | 11.430 | 11.530 | 11.640 | 11.740 |
| Fibonacci | 11.222 | 11.302 | 11.351 | 11.432 | 11.512 | 11.561 | 11.642 |
| Pivot points | S3 | S2 | S1 | PP | R1 | R2 | R3 |
|---|---|---|---|---|---|---|---|
| Standard | 10.078 | 10.687 | 11.043 | 11.652 | 12.008 | 12.617 | 12.973 |
| Camarilla | 11.135 | 11.223 | 11.312 | 11.400 | 11.489 | 11.577 | 11.665 |
| Woodie | 9.953 | 10.624 | 10.918 | 11.589 | 11.883 | 12.554 | 12.848 |
| Fibonacci | 10.687 | 11.055 | 11.283 | 11.652 | 12.020 | 12.248 | 12.617 |
| Pivot points | S3 | S2 | S1 | PP | R1 | R2 | R3 |
|---|---|---|---|---|---|---|---|
| Standard | 7.500 | 8.315 | 9.420 | 10.235 | 11.340 | 12.155 | 13.260 |
| Camarilla | 9.997 | 10.173 | 10.349 | 10.525 | 10.701 | 10.877 | 11.053 |
| Woodie | 7.645 | 8.388 | 9.565 | 10.308 | 11.485 | 12.228 | 13.405 |
| Fibonacci | 8.315 | 9.048 | 9.502 | 10.235 | 10.968 | 11.422 | 12.155 |
Numerical data
The following is the status of the technical indicators and moving averages at the time of publication of this technical analysis:
| RSI (14): | 70.97 | |
| MACD (12,26,9): | 0.0340 | |
| Directional Movement: | 26.108 | |
| AROON (14): | 85.714 | |
| DEMA (21): | 11.610 | |
| Parabolic SAR (0,02-0,02-0,2): | 11.371 | |
| Elder Ray (13): | 0.346 | |
| Super Trend (3,10): | 11.530 | |
| Zig ZAG (10): | 12.020 | |
| VORTEX (21): | 1.0670 | |
| Stochastique (14,3,5): | 83.90 | |
| TEMA (21): | 11.695 | |
| Williams %R (14): | -8.11 | |
| Chande Momentum Oscillator (20): | 0.525 | |
| Repulse (5,40,3): | 3.3570 | |
| ROCnROLL: | 1 | |
| TRIX (15,9): | -0.0410 | |
| Courbe Coppock: | 1.56 |
| MA7: | 11.691 | |
| MA20: | 11.277 | |
| MA50: | 10.341 | |
| MA100: | 10.260 | |
| MAexp7: | 11.703 | |
| MAexp20: | 11.594 | |
| MAexp50: | 11.633 | |
| MAexp100: | 11.585 | |
| Price / MA7: | +2.86% | |
| Price / MA20: | +6.63% | |
| Price / MA50: | +16.28% | |
| Price / MA100: | +17.20% | |
| Price / MAexp7: | +2.75% | |
| Price / MAexp20: | +3.72% | |
| Price / MAexp50: | +3.37% | |
| Price / MAexp100: | +3.80% |
News
The last news published on NORDEX SE O.N. at the time of the generation of this analysis was as follows:
- EQS-News: Nordex Group increases consolidated sales in 2023 to EUR 6.5 billion and achieves positive operating result
- EQS-News: Nordex Group: preliminary annual figures for 2023 confirm guidance
- EQS-News: Nordex Group achieves order intake of 7.4 GW in the fiscal year 2023
- EQS-News: Nordex Group scores highly in Germany for 2023 in terms of incoming orders and auction rounds
- EQS-News: Nordex Group receives orders for 122 MW from Denker & Wulf AG in Germany
About author
Online


Add a comment
Comments
0 comments on the analysis NORDEX SE O.N. - 1H