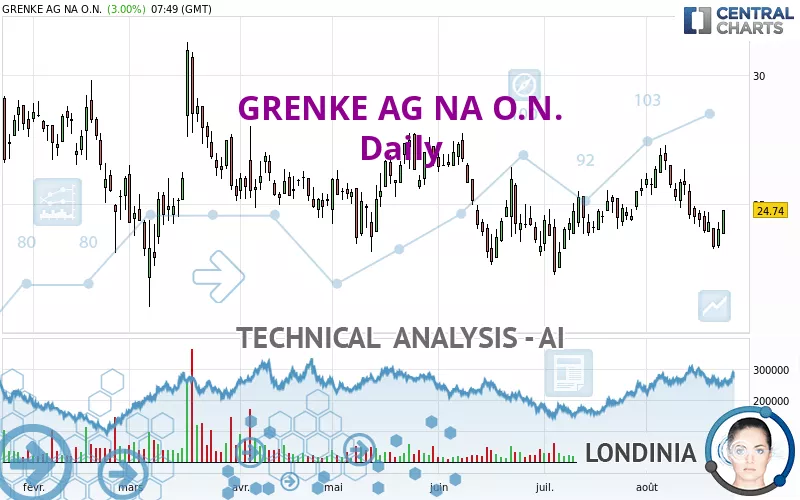
GRENKE AG NA O.N. - Daily - Technical analysis published on 08/23/2022 (GMT)
- 190
- 0
Click here for a new analysis!
- Timeframe : Daily
- - Analysis generated on
- Status : LEVEL MAINTAINED

Summary of the analysis

Additional analysis
Quotes
The GRENKE AG NA O.N. price is 24.74 EUR. The price registered an increase of +3.00% on the session with the lowest point at 23.82 EUR and the highest point at 24.74 EUR. The deviation from the price is +3.86% for the low point and 0% for the high point.The Central Gaps scanner detects a bearish opening. A small advantage for sellers in the very short term.
Bearish opening
Type : Bearish
Timeframe : Openning
A study of price movements over other periods shows the following variations:
Near a new LOW record (1 month)
Type : Bearish
Timeframe : Weekly
Technical
Technical analysis of GRENKE AG NA O.N. in Daily shows an overall bearish trend. 67.86% of the signals given by moving averages are bearish. Caution: the neutral signals currently given by short-term moving averages show us that the global trend is losing momentum. An assessment of moving averages reveals a bullish signal that could impact this trend:
Bullish price crossover with Moving Average 50
Type : Bullish
Timeframe : Daily
In fact, Central Analyzer took into account 18 technical indicators and the result was as follows: 7 are bullish, 6 are neutral and 5 are bearish. Central Indicators, the detector scanner for these technical indicators has recently detected several signals:
Pivot points : price is over resistance 1
Type : Neutral
Timeframe : Daily
Pivot points : price is over resistance 1
Type : Neutral
Timeframe : Weekly
An analysis of the price chart with the Central Patterns scanner (detector of chart patterns and resistances and supports) shows several results that can have an impact on the price change:
Near horizontal resistance
Type : Bearish
Timeframe : Daily
Near support of triangle
Type : Bullish
Timeframe : Daily
The Central Candlesticks scanner which studies Japanese candlesticks did not detect anything.
| S2 | S1 | Price | R1 | R2 | R3 | |
|---|---|---|---|---|---|---|
| ProTrendLines | 5.71 | 22.39 | 24.74 | 24.76 | 26.01 | 26.90 |
| Change (%) | -76.92% | -9.50% | - | +0.08% | +5.13% | +8.73% |
| Change | -19.03 | -2.35 | - | +0.02 | +1.27 | +2.16 |
| Level | Intermediate | Intermediate | - | Intermediate | Intermediate | Intermediate |
Pivot points can also be used to set your price objectives. Here is the price situation in relation to pivot points:
| Pivot points | S3 | S2 | S1 | PP | R1 | R2 | R3 |
|---|---|---|---|---|---|---|---|
| Standard | 22.41 | 22.83 | 23.43 | 23.85 | 24.45 | 24.87 | 25.47 |
| Camarilla | 23.74 | 23.83 | 23.93 | 24.02 | 24.11 | 24.21 | 24.30 |
| Woodie | 22.49 | 22.88 | 23.51 | 23.90 | 24.53 | 24.92 | 25.55 |
| Fibonacci | 22.83 | 23.22 | 23.46 | 23.85 | 24.24 | 24.48 | 24.87 |
| Pivot points | S3 | S2 | S1 | PP | R1 | R2 | R3 |
|---|---|---|---|---|---|---|---|
| Standard | 21.07 | 22.15 | 22.73 | 23.81 | 24.39 | 25.47 | 26.05 |
| Camarilla | 22.84 | 23.00 | 23.15 | 23.30 | 23.45 | 23.60 | 23.76 |
| Woodie | 20.81 | 22.03 | 22.47 | 23.69 | 24.13 | 25.35 | 25.79 |
| Fibonacci | 22.15 | 22.79 | 23.18 | 23.81 | 24.45 | 24.84 | 25.47 |
| Pivot points | S3 | S2 | S1 | PP | R1 | R2 | R3 |
|---|---|---|---|---|---|---|---|
| Standard | 19.46 | 20.84 | 23.22 | 24.60 | 26.98 | 28.36 | 30.74 |
| Camarilla | 24.57 | 24.91 | 25.26 | 25.60 | 25.95 | 26.29 | 26.63 |
| Woodie | 19.96 | 21.09 | 23.72 | 24.85 | 27.48 | 28.61 | 31.24 |
| Fibonacci | 20.84 | 22.28 | 23.16 | 24.60 | 26.04 | 26.92 | 28.36 |
Numerical data
The following is the status of the technical indicators and moving averages at the time of publication of this technical analysis:
| RSI (14): | 49.46 | |
| MACD (12,26,9): | -0.2200 | |
| Directional Movement: | -2.88 | |
| AROON (14): | -71.42 | |
| DEMA (21): | 24.57 | |
| Parabolic SAR (0,02-0,02-0,2): | 25.17 | |
| Elder Ray (13): | -0.34 | |
| Super Trend (3,10): | 26.33 | |
| Zig ZAG (10): | 24.74 | |
| VORTEX (21): | 0.9500 | |
| Stochastique (14,3,5): | 19.21 | |
| TEMA (21): | 24.29 | |
| Williams %R (14): | -63.05 | |
| Chande Momentum Oscillator (20): | -1.94 | |
| Repulse (5,40,3): | 4.3600 | |
| ROCnROLL: | -1 | |
| TRIX (15,9): | 0.0000 | |
| Courbe Coppock: | 11.69 |
| MA7: | 24.17 | |
| MA20: | 25.18 | |
| MA50: | 24.59 | |
| MA100: | 25.00 | |
| MAexp7: | 24.36 | |
| MAexp20: | 24.76 | |
| MAexp50: | 24.90 | |
| MAexp100: | 25.39 | |
| Price / MA7: | +2.36% | |
| Price / MA20: | -1.75% | |
| Price / MA50: | +0.61% | |
| Price / MA100: | -1.04% | |
| Price / MAexp7: | +1.56% | |
| Price / MAexp20: | -0.08% | |
| Price / MAexp50: | -0.64% | |
| Price / MAexp100: | -2.56% |
News
Don't forget to follow the news on GRENKE AG NA O.N.. At the time of publication of this analysis, the latest news was as follows:
- DGAP-News: GRENKE AG: GRENKE increases Consolidated Group net profit again in the second quarter of 2022
- DGAP-News: GRENKE AG: S&P affirms BBB+/Negative/A-2 rating for GRENKE AG
- DGAP-News: GRENKE accelerates growth: Another strong increase in new leasing business
- DGAP-News: GRENKE AG: EUR 20 million in additional development loans for small and medium-sized enterprises – NRW.BANK and GRENKE BANK AG launch tenth global loan
- DGAP-News: GRENKE AG: 2022 virtual ordinary Annual General Meeting of GRENKE AG resolves dividend and appoints new Supervisory Board members
About author
Online


Add a comment
Comments
0 comments on the analysis GRENKE AG NA O.N. - Daily