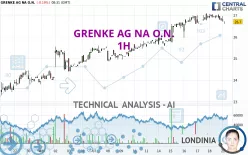
GRENKE AG NA O.N. - 1H - Technical analysis published on 10/21/2024 (GMT)
- 137
- 0
Click here for a new analysis!
- Timeframe : 1H
- - Analysis generated on
- Status : TARGET REACHED

Summary of the analysis

Additional analysis
Quotes
GRENKE AG NA O.N. rating 26.70 EUR. The price is lower by -0.19% since the last closing and was between 26.60 EUR and 26.95 EUR. This implies that the price is at +0.38% from its lowest and at -0.93% from its highest.A study of price movements over other periods shows the following variations:
Near a new HIGH record (1 month)
Type : Bullish
Timeframe : Weekly
Technical
Technical analysis of this 1H chart of GRENKE AG NA O.N. indicates that the overall trend is bullish. The signals given by moving averages are 71.43% bullish. This bullish trend could slow down given the neutral signals currently being given by short-term moving averages. An assessment of moving averages reveals a bearish signal that could impact this trend:
Bearish price crossover with adaptative moving average 50
Type : Bearish
Timeframe : 1 hour
An assessment of technical indicators does not currently provide any relevant information on the direction of future price movements.
Caution: the Central Indicators scanner currently detects an excess:
CCI indicator is oversold : under -100
Type : Neutral
Timeframe : 1 hour
Williams %R indicator is oversold : under -80
Type : Neutral
Timeframe : 1 hour
RSI indicator is back under 50
Type : Bearish
Timeframe : 1 hour
Aroon indicator bearish trend
Type : Bearish
Timeframe : 1 hour
Central Patterns, the market scanner focusing on chart patterns, resistances and supports found this result:
Near resistance of channel
Type : Bearish
Timeframe : 1 hour
There is also a Japanese candlestick pattern detected by Central Candlesticks that could mark the end of the current short-term trend:
Doji
Type : Neutral
Timeframe : 1 hour
| S3 | S2 | S1 | Price | R1 | R2 | R3 | |
|---|---|---|---|---|---|---|---|
| ProTrendLines | 24.80 | 25.77 | 26.60 | 26.70 | 27.09 | 27.70 | 28.55 |
| Change (%) | -7.12% | -3.48% | -0.37% | - | +1.46% | +3.75% | +6.93% |
| Change | -1.90 | -0.93 | -0.10 | - | +0.39 | +1.00 | +1.85 |
| Level | Intermediate | Intermediate | Major | - | Intermediate | Minor | Major |
Attention could also be paid to pivot points to set price objectives:
| Pivot points | S3 | S2 | S1 | PP | R1 | R2 | R3 |
|---|---|---|---|---|---|---|---|
| Standard | 26.35 | 26.55 | 26.65 | 26.85 | 26.95 | 27.15 | 27.25 |
| Camarilla | 26.67 | 26.70 | 26.72 | 26.75 | 26.78 | 26.81 | 26.83 |
| Woodie | 26.30 | 26.53 | 26.60 | 26.83 | 26.90 | 27.13 | 27.20 |
| Fibonacci | 26.55 | 26.67 | 26.74 | 26.85 | 26.97 | 27.04 | 27.15 |
| Pivot points | S3 | S2 | S1 | PP | R1 | R2 | R3 |
|---|---|---|---|---|---|---|---|
| Standard | 24.37 | 24.98 | 25.87 | 26.48 | 27.37 | 27.98 | 28.87 |
| Camarilla | 26.34 | 26.48 | 26.61 | 26.75 | 26.89 | 27.03 | 27.16 |
| Woodie | 24.50 | 25.05 | 26.00 | 26.55 | 27.50 | 28.05 | 29.00 |
| Fibonacci | 24.98 | 25.56 | 25.91 | 26.48 | 27.06 | 27.41 | 27.98 |
| Pivot points | S3 | S2 | S1 | PP | R1 | R2 | R3 |
|---|---|---|---|---|---|---|---|
| Standard | 17.13 | 19.12 | 21.53 | 23.52 | 25.93 | 27.92 | 30.33 |
| Camarilla | 22.74 | 23.14 | 23.55 | 23.95 | 24.35 | 24.76 | 25.16 |
| Woodie | 17.35 | 19.23 | 21.75 | 23.63 | 26.15 | 28.03 | 30.55 |
| Fibonacci | 19.12 | 20.80 | 21.84 | 23.52 | 25.20 | 26.24 | 27.92 |
Numerical data
The following is the status of the technical indicators and moving averages at the time of publication of this technical analysis:
| RSI (14): | 48.35 | |
| MACD (12,26,9): | 0.0800 | |
| Directional Movement: | 9.15 | |
| AROON (14): | -85.71 | |
| DEMA (21): | 26.93 | |
| Parabolic SAR (0,02-0,02-0,2): | 27.03 | |
| Elder Ray (13): | -0.17 | |
| Super Trend (3,10): | 26.44 | |
| Zig ZAG (10): | 26.70 | |
| VORTEX (21): | 0.8200 | |
| Stochastique (14,3,5): | 25.00 | |
| TEMA (21): | 26.83 | |
| Williams %R (14): | -80.00 | |
| Chande Momentum Oscillator (20): | -0.35 | |
| Repulse (5,40,3): | -0.2900 | |
| ROCnROLL: | -1 | |
| TRIX (15,9): | 0.0700 | |
| Courbe Coppock: | 0.53 |
| MA7: | 26.48 | |
| MA20: | 25.24 | |
| MA50: | 24.80 | |
| MA100: | 24.56 | |
| MAexp7: | 26.81 | |
| MAexp20: | 26.79 | |
| MAexp50: | 26.48 | |
| MAexp100: | 25.92 | |
| Price / MA7: | +0.83% | |
| Price / MA20: | +5.78% | |
| Price / MA50: | +7.66% | |
| Price / MA100: | +8.71% | |
| Price / MAexp7: | -0.41% | |
| Price / MAexp20: | -0.34% | |
| Price / MAexp50: | +0.83% | |
| Price / MAexp100: | +3.01% |
News
The latest news and videos published on GRENKE AG NA O.N. at the time of the analysis were as follows:
- EQS-News: grenke achieves strong new business in Q3 2024
- EQS-News: grenke successfully concludes share buyback program
- EQS-News: grenke continues to gain traction in the USA
- EQS-News: Changes in the Board of Directors
- EQS-News: grenke increases Group earnings and improves cost-income ratio in the first half of 2024
About author
Online


Add a comment
Comments
0 comments on the analysis GRENKE AG NA O.N. - 1H