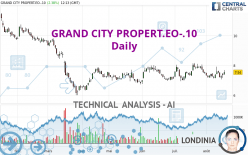
GRAND CITY PROPERT.EO-.10 - Daily - Technical analysis published on 08/17/2023 (GMT)
- 192
- 0
Click here for a new analysis!
- Timeframe : Daily
- - Analysis generated on
- Status : TARGET REACHED

Summary of the analysis

Additional analysis
Quotes
GRAND CITY PROPERT.EO-.10 rating 7.540 EUR. The price has increased by +2.38% since the last closing and was between 7.355 EUR and 7.700 EUR. This implies that the price is at +2.52% from its lowest and at -2.08% from its highest.Here is a more detailed summary of the historical variations registered by GRAND CITY PROPERT.EO-.10:
Near a new LOW record (1 month)
Type : Bearish
Timeframe : Weekly
Technical
Technical analysis of this Daily chart of GRAND CITY PROPERT.EO-.10 indicates that the overall trend is slightly bullish. 57.14% of the signals given by moving averages are bullish. The slightly bullish signals given by short-term moving averages do not show a strengthening of this global trend. The Central Indicators scanner detects bullish signals on moving averages that could impact this trend:
Bullish price crossover with Moving Average 20
Type : Bullish
Timeframe : Daily
Bullish price crossover with Moving Average 50
Type : Bullish
Timeframe : Daily
Bullish price crossover with adaptative moving average 20
Type : Bullish
Timeframe : Daily
Bullish price crossover with adaptative moving average 50
Type : Bullish
Timeframe : Daily
In fact, according to the parameters integrated into the Central Analyzer system, only 9 technical indicators out of 18 analysed are currently bullish. Central Indicators, the scanner specialised in technical indicators, has identified these signals:
Pivot points : price is over resistance 1
Type : Neutral
Timeframe : Daily
RSI indicator is back over 50
Type : Bullish
Timeframe : Daily
Ichimoku : price is over the cloud
Type : Bullish
Timeframe : Daily
Momentum indicator is back over 0
Type : Bullish
Timeframe : Daily
Williams %R indicator is back over -50
Type : Bullish
Timeframe : Daily
Central Patterns, the market scanner focusing on chart patterns, resistances and supports found these results:
Near resistance of channel
Type : Bearish
Timeframe : Daily
Near resistance of triangle
Type : Bearish
Timeframe : Daily
The Central Candlesticks scanner which studies Japanese candlesticks did not detect anything.
| S3 | S2 | S1 | Price | R1 | R2 | R3 | |
|---|---|---|---|---|---|---|---|
| ProTrendLines | 6.160 | 6.605 | 7.035 | 7.540 | 7.899 | 8.838 | 9.747 |
| Change (%) | -18.30% | -12.40% | -6.70% | - | +4.76% | +17.21% | +29.27% |
| Change | -1.380 | -0.935 | -0.505 | - | +0.359 | +1.298 | +2.207 |
| Level | Major | Minor | Major | - | Intermediate | Minor | Minor |
Pivot points can also be used to set your price objectives. Here is the price situation in relation to pivot points:
| Pivot points | S3 | S2 | S1 | PP | R1 | R2 | R3 |
|---|---|---|---|---|---|---|---|
| Standard | 6.903 | 7.042 | 7.203 | 7.342 | 7.503 | 7.642 | 7.803 |
| Camarilla | 7.283 | 7.310 | 7.338 | 7.365 | 7.393 | 7.420 | 7.448 |
| Woodie | 6.915 | 7.048 | 7.215 | 7.348 | 7.515 | 7.648 | 7.815 |
| Fibonacci | 7.042 | 7.156 | 7.227 | 7.342 | 7.456 | 7.527 | 7.642 |
| Pivot points | S3 | S2 | S1 | PP | R1 | R2 | R3 |
|---|---|---|---|---|---|---|---|
| Standard | 6.342 | 6.733 | 7.137 | 7.528 | 7.932 | 8.323 | 8.727 |
| Camarilla | 7.321 | 7.394 | 7.467 | 7.540 | 7.613 | 7.686 | 7.759 |
| Woodie | 6.348 | 6.736 | 7.143 | 7.531 | 7.938 | 8.326 | 8.733 |
| Fibonacci | 6.733 | 7.037 | 7.225 | 7.528 | 7.832 | 8.020 | 8.323 |
| Pivot points | S3 | S2 | S1 | PP | R1 | R2 | R3 |
|---|---|---|---|---|---|---|---|
| Standard | 5.678 | 6.307 | 6.903 | 7.532 | 8.128 | 8.757 | 9.353 |
| Camarilla | 7.163 | 7.275 | 7.388 | 7.500 | 7.612 | 7.725 | 7.837 |
| Woodie | 5.663 | 6.299 | 6.888 | 7.524 | 8.113 | 8.749 | 9.338 |
| Fibonacci | 6.307 | 6.775 | 7.064 | 7.532 | 8.000 | 8.289 | 8.757 |
Numerical data
The following are the details of the technical indicators and moving averages that were collected to generate this technical analysis:
| RSI (14): | 53.17 | |
| MACD (12,26,9): | -0.0310 | |
| Directional Movement: | 11.725 | |
| AROON (14): | -21.428 | |
| DEMA (21): | 7.408 | |
| Parabolic SAR (0,02-0,02-0,2): | 7.810 | |
| Elder Ray (13): | 0.105 | |
| Super Trend (3,10): | 7.111 | |
| Zig ZAG (10): | 7.570 | |
| VORTEX (21): | 0.9260 | |
| Stochastique (14,3,5): | 37.91 | |
| TEMA (21): | 7.366 | |
| Williams %R (14): | -41.18 | |
| Chande Momentum Oscillator (20): | 0.225 | |
| Repulse (5,40,3): | 1.1850 | |
| ROCnROLL: | 1 | |
| TRIX (15,9): | -0.0520 | |
| Courbe Coppock: | 7.12 |
| MA7: | 7.418 | |
| MA20: | 7.502 | |
| MA50: | 7.474 | |
| MA100: | 7.324 | |
| MAexp7: | 7.412 | |
| MAexp20: | 7.442 | |
| MAexp50: | 7.472 | |
| MAexp100: | 7.694 | |
| Price / MA7: | +1.64% | |
| Price / MA20: | +0.51% | |
| Price / MA50: | +0.88% | |
| Price / MA100: | +2.95% | |
| Price / MAexp7: | +1.73% | |
| Price / MAexp20: | +1.32% | |
| Price / MAexp50: | +0.91% | |
| Price / MAexp100: | -2.00% |
News
The latest news and videos published on GRAND CITY PROPERT.EO-.10 at the time of the analysis were as follows:
- GCP S.A. announces H1 2023 results
- EQS-News: GCP S.A. announces H1 2023 results
- Grand City Properties S.A. announces publication of convening notice for the 2023 Annual General Meeting
- EQS-News: Grand City Properties S.A. announces publication of convening notice for the 2023 Annual General Meeting
- Grand City Properties S.A.: GCP S.A. ANNOUNCES Q1 2023 RESULTS
About author
Online


Add a comment
Comments
0 comments on the analysis GRAND CITY PROPERT.EO-.10 - Daily