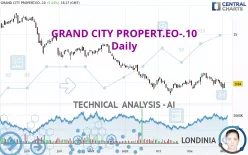
GRAND CITY PROPERT.EO-.10 - Daily - Technical analysis published on 12/02/2022 (GMT)
- 215
- 0
Click here for a new analysis!
- Timeframe : Daily
- - Analysis generated on
- Status : TARGET REACHED

Summary of the analysis

Additional analysis
Quotes
The GRAND CITY PROPERT.EO-.10 rating is 9.840 EUR. The price has increased by +5.24% since the last closing and was between 9.355 EUR and 9.975 EUR. This implies that the price is at +5.18% from its lowest and at -1.35% from its highest.A bullish opening was detected by the Central Gaps scanner. Buyers are trying to impose a bullish momentum in the very short term.
Bullish opening
Type : Bullish
Timeframe : Openning
So that you have an overall view of the price change, here is a table showing the variations over several periods:
Near a new LOW record (1 month)
Type : Bearish
Timeframe : Weekly
Technical
A technical analysis in Daily of this GRAND CITY PROPERT.EO-.10 chart shows a sharp bearish trend. The signals given by moving averages are 85.71% bearish. This strongly bearish trend seems to be slowing down given the slightly bearish signals being given by short-term moving averages. There is no crossing of moving average by the price or crossing of moving averages between themselves.
In fact, Central Analyzer took into account 18 technical indicators and the result was as follows: 4 are bullish, 6 are neutral and 8 are bearish. Caution: the Central Indicators scanner currently detects an excess:
CCI indicator is oversold : under -100
Type : Neutral
Timeframe : Daily
Previous candle closed under Bollinger bands
Type : Neutral
Timeframe : Daily
Pivot points : price is over resistance 1
Type : Neutral
Timeframe : Daily
Price is back under the pivot point
Type : Bearish
Timeframe : Weekly
Central Patterns, the scanner specializing in chart patterns, did not identify any signals.
The Central Candlesticks scanner, specialised in Japanese candlesticks, did not identify any signals.
| S2 | S1 | Price | R1 | R2 | R3 | |
|---|---|---|---|---|---|---|
| ProTrendLines | 4.931 | 8.865 | 9.840 | 10.842 | 12.657 | 14.181 |
| Change (%) | -49.89% | -9.91% | - | +10.18% | +28.63% | +44.12% |
| Change | -4.909 | -0.975 | - | +1.002 | +2.817 | +4.341 |
| Level | Intermediate | Major | - | Intermediate | Intermediate | Major |
Attention could also be paid to pivot points to set price objectives:
| Pivot points | S3 | S2 | S1 | PP | R1 | R2 | R3 |
|---|---|---|---|---|---|---|---|
| Standard | 8.627 | 8.983 | 9.167 | 9.523 | 9.707 | 10.063 | 10.247 |
| Camarilla | 9.202 | 9.251 | 9.301 | 9.350 | 9.400 | 9.449 | 9.499 |
| Woodie | 8.540 | 8.940 | 9.080 | 9.480 | 9.620 | 10.020 | 10.160 |
| Fibonacci | 8.983 | 9.190 | 9.317 | 9.523 | 9.730 | 9.857 | 10.063 |
| Pivot points | S3 | S2 | S1 | PP | R1 | R2 | R3 |
|---|---|---|---|---|---|---|---|
| Standard | 8.828 | 9.237 | 9.723 | 10.132 | 10.618 | 11.027 | 11.513 |
| Camarilla | 9.964 | 10.046 | 10.128 | 10.210 | 10.292 | 10.374 | 10.456 |
| Woodie | 8.868 | 9.256 | 9.763 | 10.151 | 10.658 | 11.046 | 11.553 |
| Fibonacci | 9.237 | 9.579 | 9.790 | 10.132 | 10.474 | 10.685 | 11.027 |
| Pivot points | S3 | S2 | S1 | PP | R1 | R2 | R3 |
|---|---|---|---|---|---|---|---|
| Standard | 7.158 | 8.207 | 8.873 | 9.922 | 10.588 | 11.637 | 12.303 |
| Camarilla | 9.068 | 9.226 | 9.383 | 9.540 | 9.697 | 9.854 | 10.012 |
| Woodie | 6.968 | 8.111 | 8.683 | 9.826 | 10.398 | 11.541 | 12.113 |
| Fibonacci | 8.207 | 8.862 | 9.267 | 9.922 | 10.577 | 10.982 | 11.637 |
Numerical data
The following is the status of technical indicators and moving averages registered at the time this technical analysis was created:
| RSI (14): | 46.48 | |
| MACD (12,26,9): | -0.0960 | |
| Directional Movement: | -9.287 | |
| AROON (14): | -78.571 | |
| DEMA (21): | 9.930 | |
| Parabolic SAR (0,02-0,02-0,2): | 10.535 | |
| Elder Ray (13): | -0.294 | |
| Super Trend (3,10): | 10.880 | |
| Zig ZAG (10): | 9.830 | |
| VORTEX (21): | 1.0110 | |
| Stochastique (14,3,5): | 11.11 | |
| TEMA (21): | 9.892 | |
| Williams %R (14): | -69.33 | |
| Chande Momentum Oscillator (20): | -0.610 | |
| Repulse (5,40,3): | -2.7300 | |
| ROCnROLL: | 2 | |
| TRIX (15,9): | 0.0380 | |
| Courbe Coppock: | 10.74 |
| MA7: | 9.889 | |
| MA20: | 10.200 | |
| MA50: | 9.914 | |
| MA100: | 11.125 | |
| MAexp7: | 9.829 | |
| MAexp20: | 10.015 | |
| MAexp50: | 10.280 | |
| MAexp100: | 11.274 | |
| Price / MA7: | -0.50% | |
| Price / MA20: | -3.53% | |
| Price / MA50: | -0.75% | |
| Price / MA100: | -11.55% | |
| Price / MAexp7: | +0.11% | |
| Price / MAexp20: | -1.75% | |
| Price / MAexp50: | -4.28% | |
| Price / MAexp100: | -12.72% |
News
The latest news and videos published on GRAND CITY PROPERT.EO-.10 at the time of the analysis were as follows:
- Grand City Properties S.A. decides not to exercise its option to voluntarily call EUR 200 million 2.75% Perpetual Notes with call date in January 2023
- EQS-Adhoc: Grand City Properties S.A. decides not to exercise its option to voluntarily call EUR 200 million 2.75% Perpetual Notes with call date in January 2023
- Grand City Properties S.A. announces 9M 2022 results
- EQS-News: Grand City Properties S.A. announces 9M 2022 results
- Grand City Properties S.A. announces H1 2022 results
About author
Online


Add a comment
Comments
0 comments on the analysis GRAND CITY PROPERT.EO-.10 - Daily